Between 1574 and 1579 Christopher Saxton surveyed the counties of England and Wales, had them engraved and published them in 1579 as the first atlas of its counties. How good was it? I read 857 towns, bridges and river mouths on all 34 county maps and on the general map, and set each against where the place really is.
01Saxton's towns are where they should be
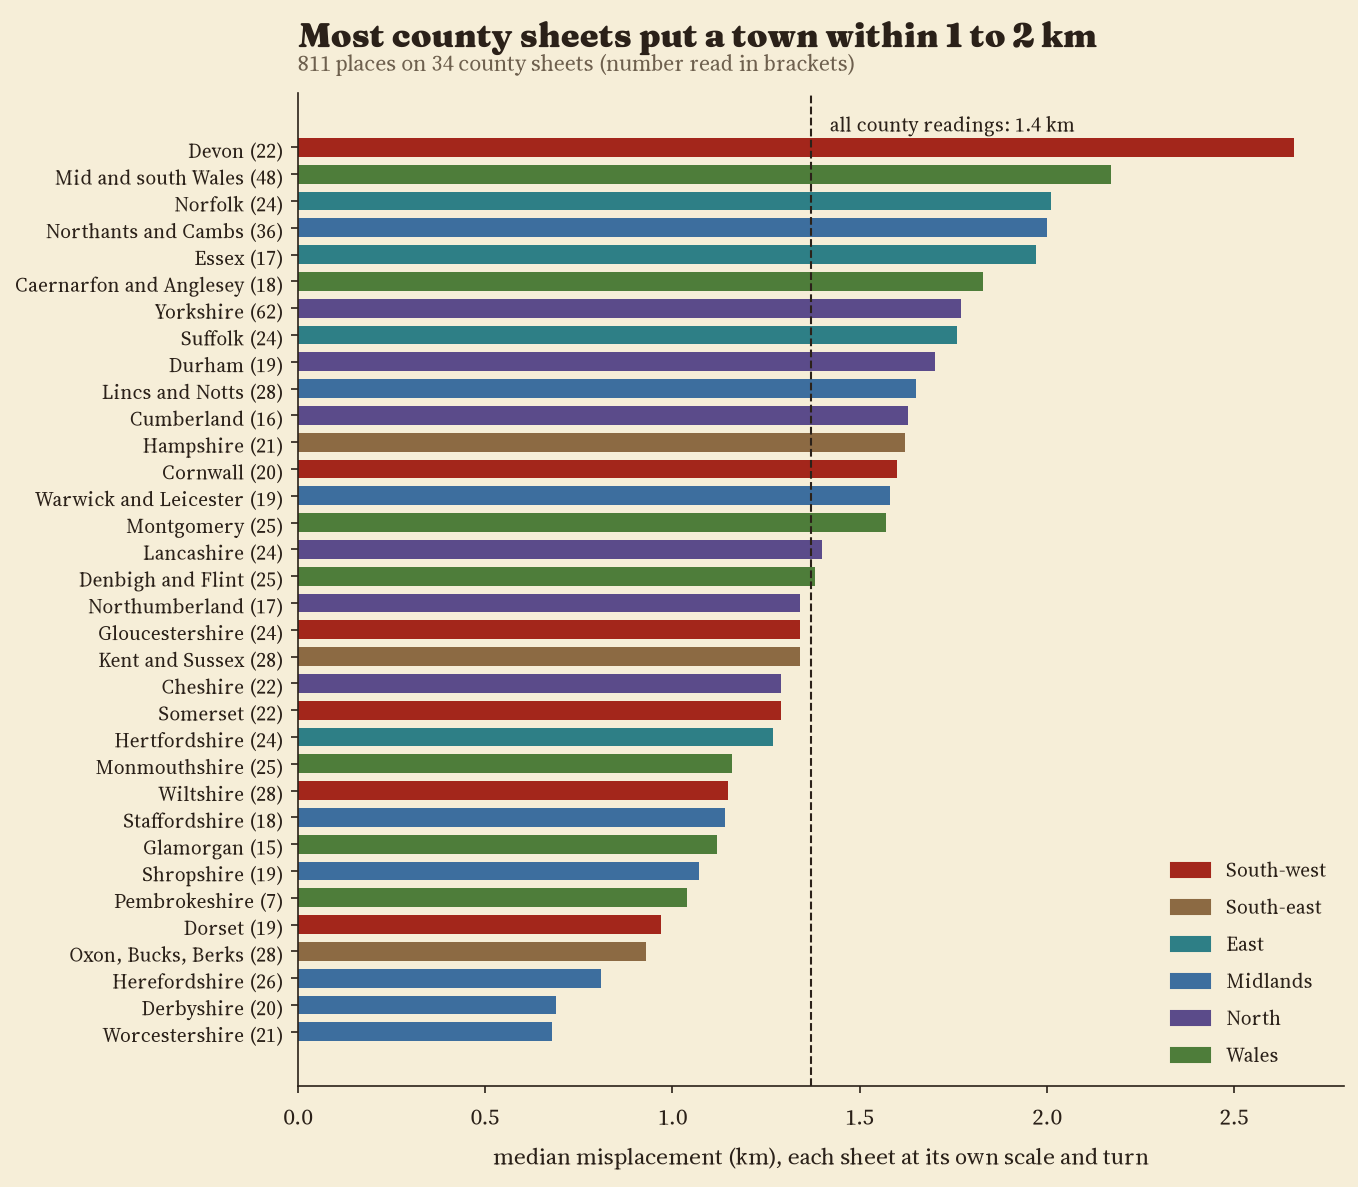
I fitted each sheet to the real ground with one scale, one turn and one shift, so that every sheet is judged on its own terms. Across 811 readings the median town sits 1.4 km from where its sheet puts it; 32% are within 1 km and all but 5 within 5 km. The best drawn sheet is Worcestershire (median 0.68 km), the weakest Devon (2.66 km). Allowing each sheet to stretch (an affine fit) only brings the median to 1.3 km, so the shapes are true and not squashed: the median sheet is stretched by a factor of only 1.05.
02North leans to the west
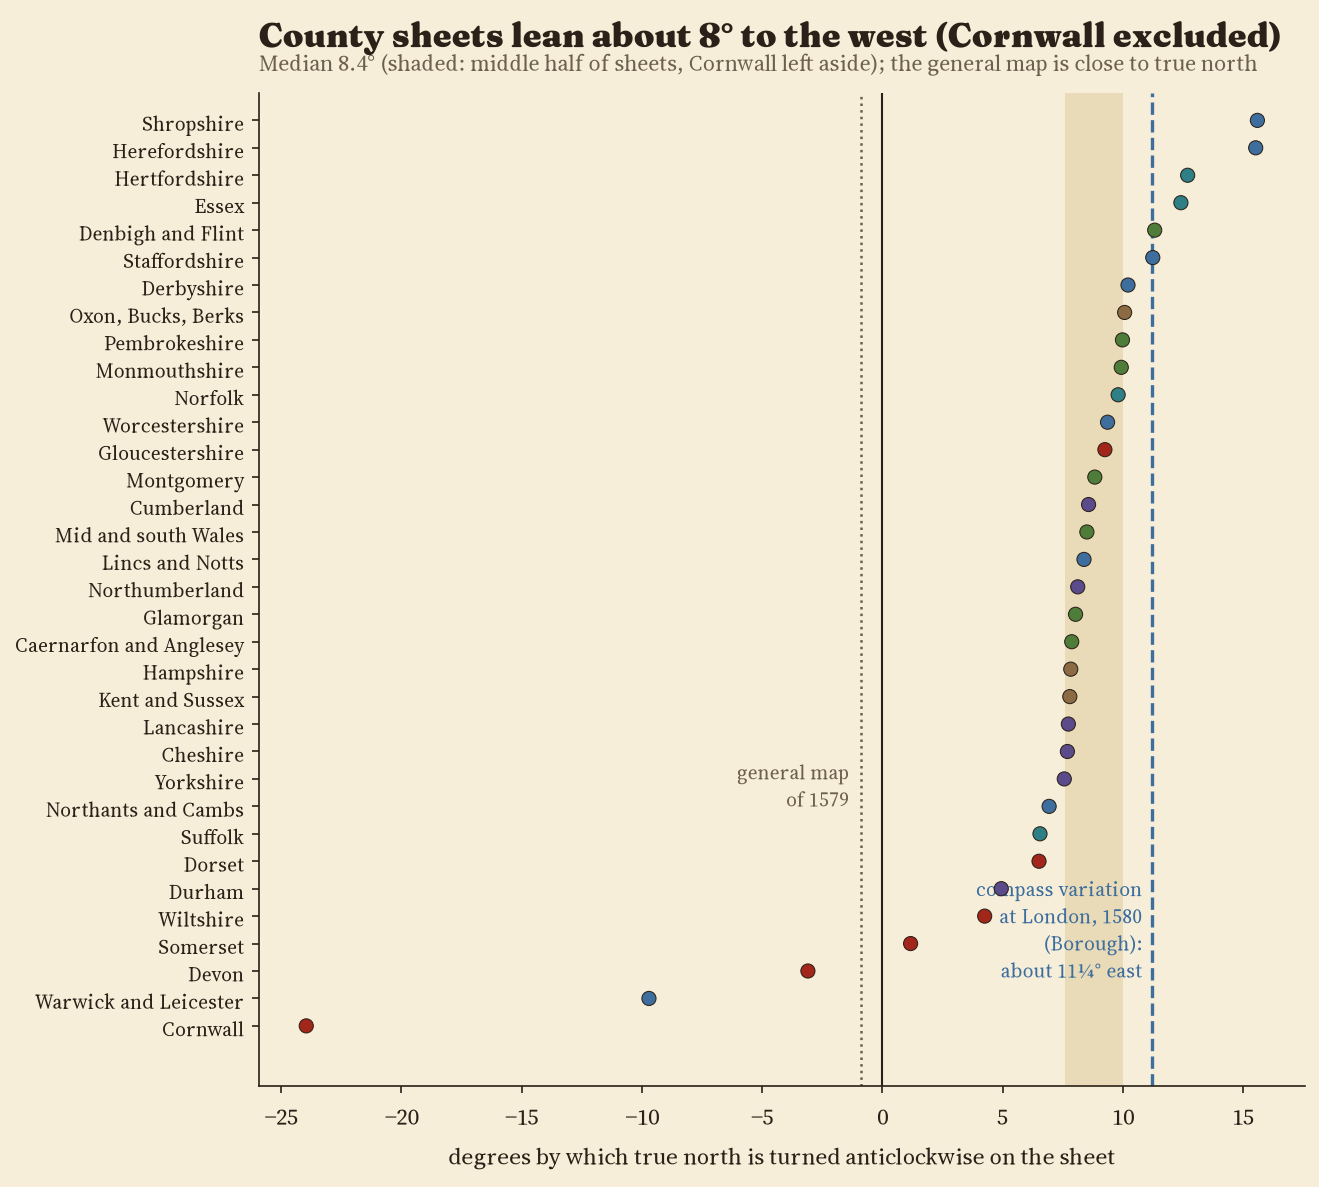
The surprise is the direction. On 31 of 34 county sheets, true north is turned anticlockwise: the top of the sheet points east of true north. The middle half of sheets lean between 7.6° and 10.0°, with a median of 8.4° (Cornwall excluded). That is close to the compass variation that William Borough measured at Limehouse in 1580, about 11¼° east, which is what you would expect if the surveys were laid out by magnetic compass. The general map of 1579, by contrast, is turned only -0.9°. Cornwall is the outlier: turned 24° the other way, possibly so that the long peninsula fits the plate.
03The general map against the Gough Map
On the general map of England and Wales (46 towns read) the median town is 4.2 km out, at a scale about 6.9 times smaller than a typical county sheet. The Gough Map, about two centuries older and measured the same way, misplaces its median way station by 17.6 km, 4.2 times as much.
04Sheets agree with each other
16 towns appear on two neighbouring county sheets. Taking each back to the ground through its own sheet's fit, the two positions differ by a median of 2.30 km, the most being Llanidloes (5.2 km). Scales differ a lot: Hertfordshire is drawn 2.6 times larger than Yorkshire.
| Map | Towns | Median km | Turn ° | Stretch |
|---|---|---|---|---|
| General map (1579) | 46 | 4.23 | -0.9 | 1.02 |
| Kent and Sussex (1575) | 28 | 1.34 | +7.8 | 1.01 |
| Hampshire (1575) | 21 | 1.62 | +7.8 | 1.08 |
| Dorset (1575) | 19 | 0.97 | +6.5 | 1.05 |
| Wiltshire (1576) | 28 | 1.15 | +4.2 | 1.10 |
| Somerset (1575) | 22 | 1.29 | +1.2 | 1.02 |
| Devon (1575) | 22 | 2.66 | -3.1 | 1.14 |
| Cornwall (1576) | 20 | 1.60 | -24.0 | 1.02 |
| Essex (1576) | 17 | 1.97 | +12.4 | 1.05 |
| Hertfordshire (1577) | 24 | 1.27 | +12.7 | 1.09 |
| Oxon, Bucks, Berks (1574) | 28 | 0.93 | +10.1 | 1.02 |
| Gloucestershire (1577) | 24 | 1.34 | +9.2 | 1.07 |
| Suffolk (1575) | 24 | 1.76 | +6.5 | 1.09 |
| Norfolk (1574) | 24 | 2.01 | +9.8 | 1.03 |
| Northants and Cambs (1576) | 36 | 2.00 | +6.9 | 1.04 |
| Warwick and Leicester (1576) | 19 | 1.58 | -9.7 | 1.07 |
| Staffordshire (1577) | 18 | 1.14 | +11.2 | 1.02 |
| Worcestershire (1577) | 21 | 0.68 | +9.4 | 1.01 |
| Shropshire (1577) | 19 | 1.07 | +15.6 | 1.03 |
| Herefordshire (1577) | 26 | 0.81 | +15.5 | 1.08 |
| Lincs and Notts (1576) | 28 | 1.65 | +8.4 | 1.00 |
| Derbyshire (1577) | 20 | 0.69 | +10.2 | 1.02 |
| Cheshire (1577) | 22 | 1.29 | +7.7 | 1.05 |
| Yorkshire (1577) | 62 | 1.77 | +7.6 | 1.05 |
| Lancashire (1577) | 24 | 1.40 | +7.7 | 1.02 |
| Durham (1576) | 19 | 1.70 | +4.9 | 1.14 |
| Cumberland (1576) | 16 | 1.63 | +8.6 | 1.05 |
| Northumberland (1576) | 17 | 1.34 | +8.1 | 1.04 |
| Monmouthshire (1577) | 25 | 1.16 | +9.9 | 1.14 |
| Glamorgan (1578) | 15 | 1.12 | +8.0 | 1.10 |
| Mid and south Wales (1578) | 48 | 2.17 | +8.5 | 1.07 |
| Pembrokeshire (1578) | 7 | 1.04 | +10.0 | 1.05 |
| Montgomery (1578) | 25 | 1.57 | +8.8 | 1.06 |
| Denbigh and Flint (1577) | 25 | 1.38 | +11.3 | 1.16 |
| Caernarfon and Anglesey (1578) | 18 | 1.83 | +7.9 | 1.08 |
05How I did this
The scans are the Bibliothèque nationale de France copy of the atlas on Wikimedia Commons (41 files: the general map, the 34 county maps, a map of Scotland bound with them and five single sheets from other copies, which duplicate Devon, Dorset, Cornwall, Wiltshire and Somerset and were not used). For each sheet I read town symbols (church or castle), named in the engraving, on zoomed crops, guided by a prediction from the towns already read, and matched each to its Wikidata settlement point; I flagged each reading as certain, probable or doubtful in its exact point. 77% of county readings are certain. True positions were put on a flat frame in kilometres centred on each sheet. Every reading was then checked again on a zoomed crop; misplaced symbols were corrected and doubtful identifications dropped. A thin plate spline bends the true grid onto each sheet.
Caveats
- I read all 34 county sheets and the general map.
- Wikidata points mark a modern centre, often a few hundred metres from the old church, so part of each misplacement is mine, not Saxton's.
- Readings by eye on 3,840 px scans; the scanner's own skew may add a degree to the turns.
- The magnetic explanation of the turn is a reading of the pattern, not proof; I did not test the scale bars.
Sources and licences
- Christopher Saxton, atlas of England and Wales, 1574 to 1579. Bibliothèque nationale de France, ark:/12148/btv1b55007148q; scans via Wikimedia Commons, public domain.
- Settlement points: Wikidata (CC0). Coastlines: Natural Earth (public domain). Base map: OpenFreeMap, © OpenStreetMap contributors (ODbL).
- Borough, W. (1581) A Discours of the Variation of the Cumpas. London. Value as given in Encyclopaedia Britannica (1911), "Magnetism, Terrestrial".
- Evans, I. M. and Lawrence, H. (1979) Christopher Saxton, Elizabethan map-maker. Wakefield Historical Publications and Holland Press.