Portolan charts are the first maps that look right. Drawn in ink on a single animal skin from the late 1200s, criss-crossed with compass lines and crowded with harbour names written at right angles to the coast, they show the Mediterranean and the Black Sea with a shape you would recognise at a glance, two centuries before anyone drew latitude lines on a sea chart. Nobody knows quite how they were made. I wanted to know how good they actually are, so I read 148 places on the oldest one to survive, the Carta Pisana (about 1275), and 201 on the chart of the Catalan Atlas (1375), and measured every one against the real coast.
Above, the left map is the chart itself. The red lines are the true meridians and parallels every 5 degrees, bent to follow the drawing: where they run straight and evenly spaced the chart is faithful, where they kink it is not. Slide the bar to morph the real coastline from the chart's shape to its own best straight frame, and tap any ring to see the same place on the modern ink map on the right. Use the chips to switch charts.
01 · The tiltTen degrees off north
Fit either chart to the real coast with a single scale and a single turn, the simplest possible "best match", and the turn is not zero. The Carta Pisana comes out rotated 10.4 degrees anticlockwise, the Catalan Atlas 11.9 degrees. You can see it in the grid on the map above: the parallels climb from west to east. A ship sailing due east from Gibraltar would, on these charts, be heading for a coast that is drawn too far north, which is why the Levant sits high and the Strait of Gibraltar low.
The same tilt shows in directions. Over 10,738 pairs of Pisana places at least 100 km apart, the direction on the chart is a median 10.2 degrees off the true compass bearing, anticlockwise for 94% of them. Turn the chart back by its fitted rotation and the median error falls to 2.1 degrees; 78% of pairs are then within 5 degrees. For the Catalan Atlas the figures are 10.9 and 3.0 degrees. In other words the charts are not vague about direction: they are precise, but about a north that is not true north.
The usual explanation is the magnetic compass. If the chart makers built their coasts from compass courses, and the compass pointed several degrees east of true north in the medieval Mediterranean, the whole drawing would be turned by that amount. Historians still argue about whether declination alone can explain a tilt this large; what the measurement shows is that the turn is about the same size on two charts made a century apart, and that on the Pisana the western and eastern basins, fitted separately, turn by almost the same amount (9.7 and 10.0 degrees).
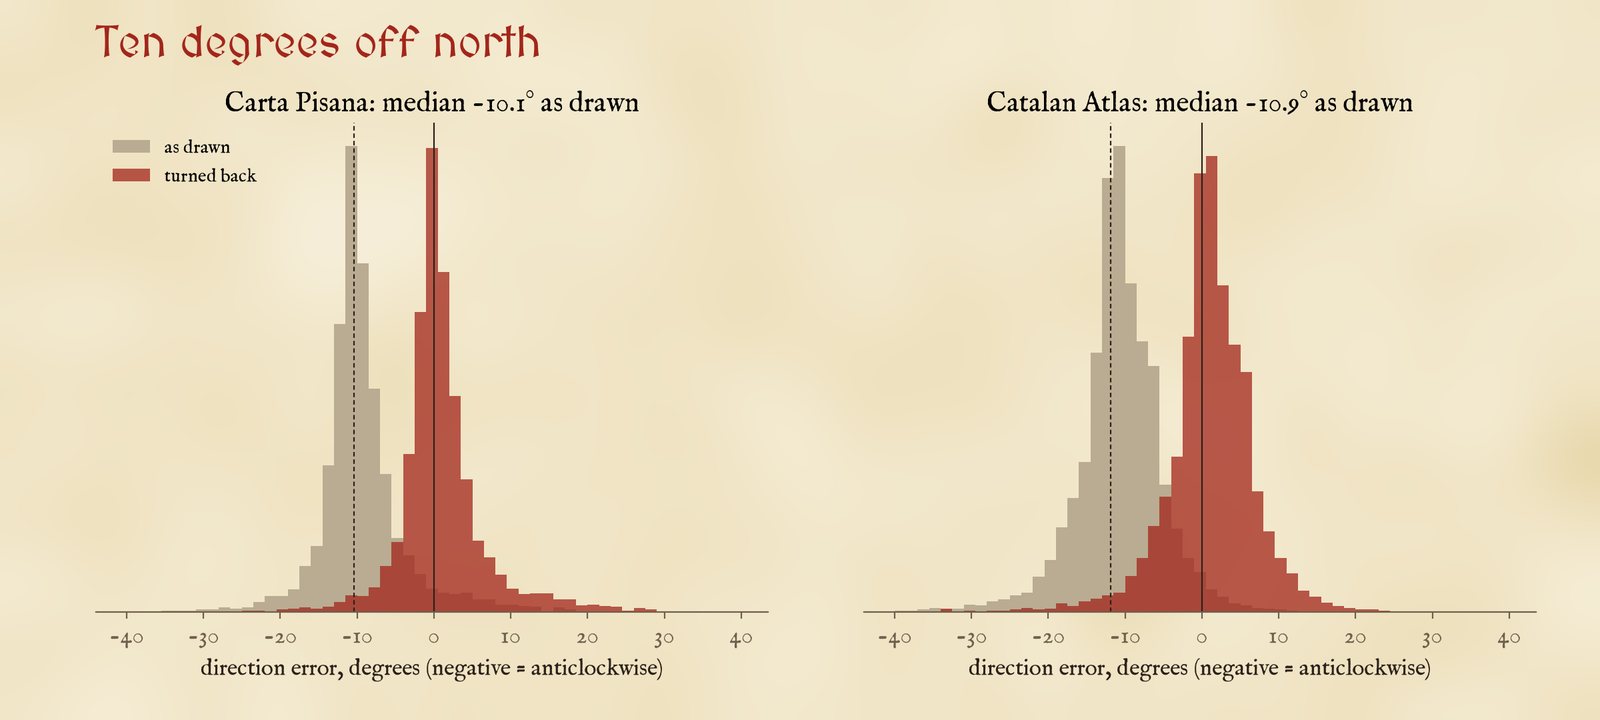
Direction on the chart minus the true rhumb-line direction, for every pair of places at least 100 km apart. Grey: as drawn. Red: after turning the chart back by its fitted rotation.
02 · Sea by seaSuperb at home, lost in the Atlantic
With the tilt taken out, the Carta Pisana places its Mediterranean harbours with a median error of 86 km in the west and 81 km in the east, on a map more than 3,000 km wide. Give each basin its own scale and turn and the errors fall to 36 km and 43 km. Judged against its eight nearest neighbours, which ignores how the pieces join, the median Pisana place is 38 km out and the median Catalan place 27 km; Capo Peloro by Messina, Almería and Sidon are within a few kilometres of where their neighbours say they should be.
The Atlantic coasts are another matter. The Pisana's Biscay, Channel and Flemish coast are a median 312 km out, 3.7 times worse than the Mediterranean, and Britain is a schematic box. Even fitted on their own they come out 18% too small against the rest of the chart. The Catalan Atlas, a century later, has a recognisable Ireland and Britain, Madeira and the Canaries, but its Atlantic places are still a median 215 km out, the worst being Dunnet Head at the tip of Scotland (587 km), and its Atlantic is drawn 22% too small.
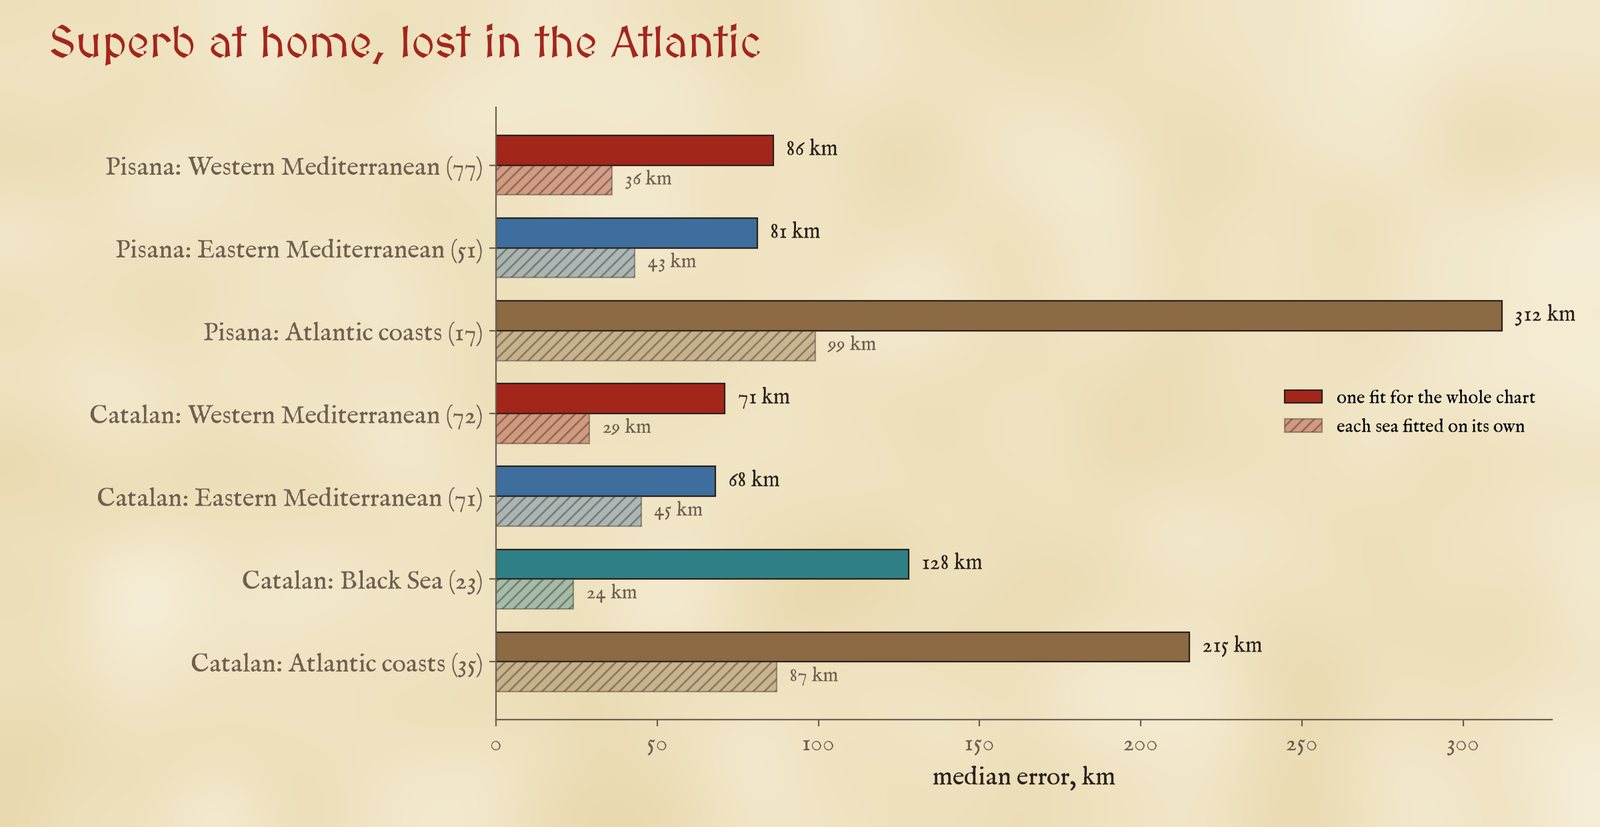
Median error by sea. Solid: with one fit for the whole chart. Pale: with each sea fitted on its own (seas with at least eight places).
| Chart and sea | Places | Whole-chart fit | Own fit | Own turn | Own scale |
|---|---|---|---|---|---|
| Carta Pisana: Western Mediterranean | 77 | 86 | 36 | 9.7° | 1.02 |
| Carta Pisana: Eastern Mediterranean | 51 | 81 | 43 | 10.0° | 1.05 |
| Carta Pisana: Atlantic coasts | 17 | 312 | 99 | -2.1° | 0.82 |
| Catalan Atlas: Western Mediterranean | 72 | 71 | 29 | 7.4° | 0.99 |
| Catalan Atlas: Eastern Mediterranean | 71 | 68 | 45 | 11.1° | 1.02 |
| Catalan Atlas: Black Sea | 23 | 128 | 24 | 12.9° | 1.04 |
| Catalan Atlas: Atlantic coasts | 35 | 215 | 87 | 5.5° | 0.78 |
Errors are medians in km. "Own scale" is the sea's scale against the whole chart's: below 1 means drawn too small.
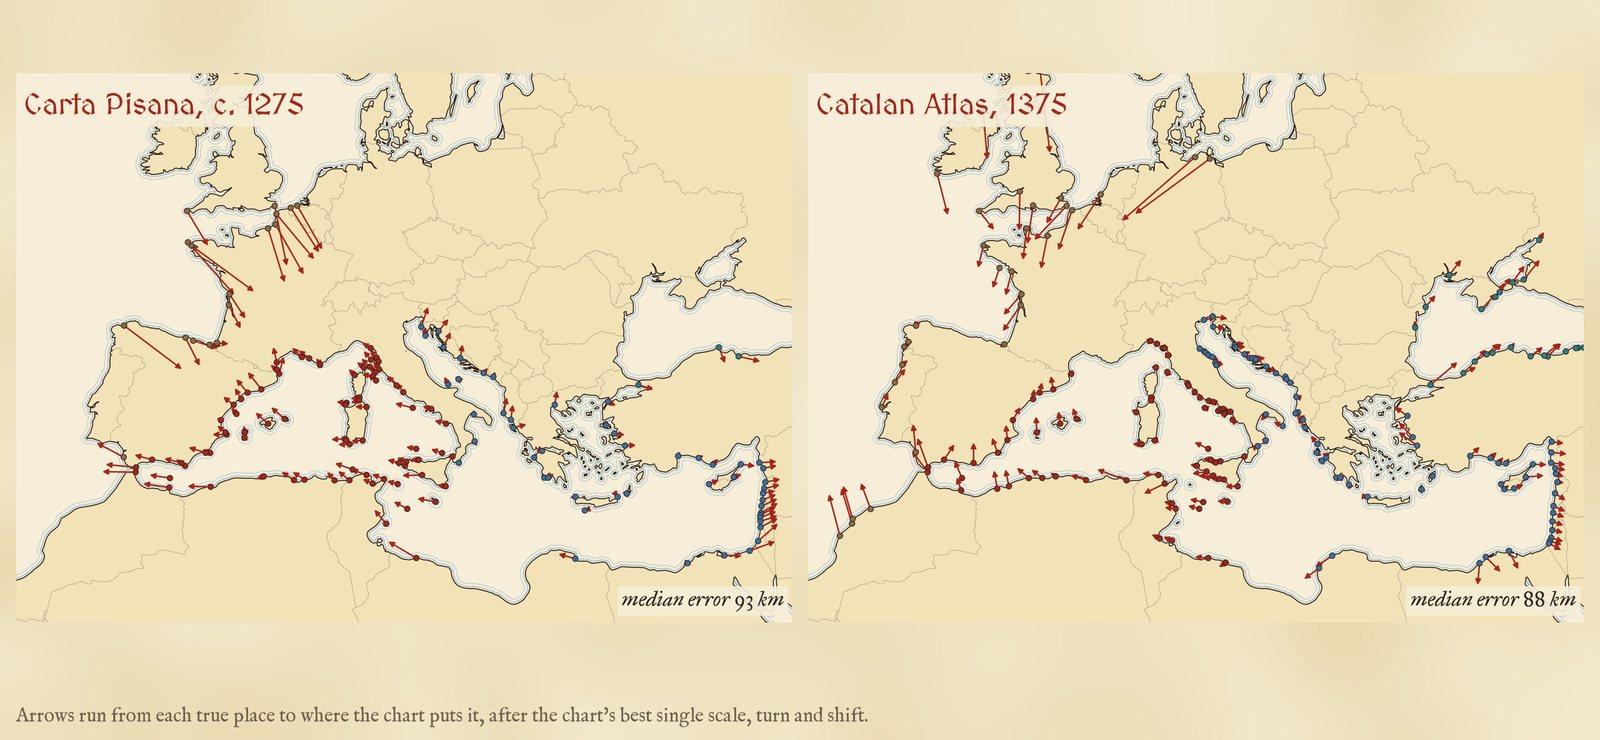
Where the Carta Pisana puts each place, after its best single scale and turn (red lines run from the true place).
03 · WhyCharts made from sailing
The pattern fits the way the charts were used. The Mediterranean was sailed constantly by Genoese, Venetian, Pisan, Catalan and Majorcan ships, and the written sailing directions of the time (the portolani that gave the charts their name) list courses by compass wind and distances in miles between harbour after harbour. A chart built up from thousands of such courses, averaged and corrected over generations, would be good locally everywhere, a little stretched or turned from one basin to the next, and tilted as a whole by the compass. The Atlantic coasts beyond Gibraltar were sailed far less by the same people, the tides and long open crossings of Biscay make dead reckoning harder, and the chart makers seem to have fitted them on at the edges. Britain, which few Mediterranean pilots knew, stays a sketch.
The grid tells the same story. A straight frame with equal degrees of longitude and latitude (scaled for 38° N) fits the Pisana a little better than Mercator (86 against 93 km; Catalan Atlas 71 against 88 km), so on these readings there is no sign of a hidden Mercator-like construction, though over a sea that spans only 15 degrees of latitude the two are hard to tell apart.
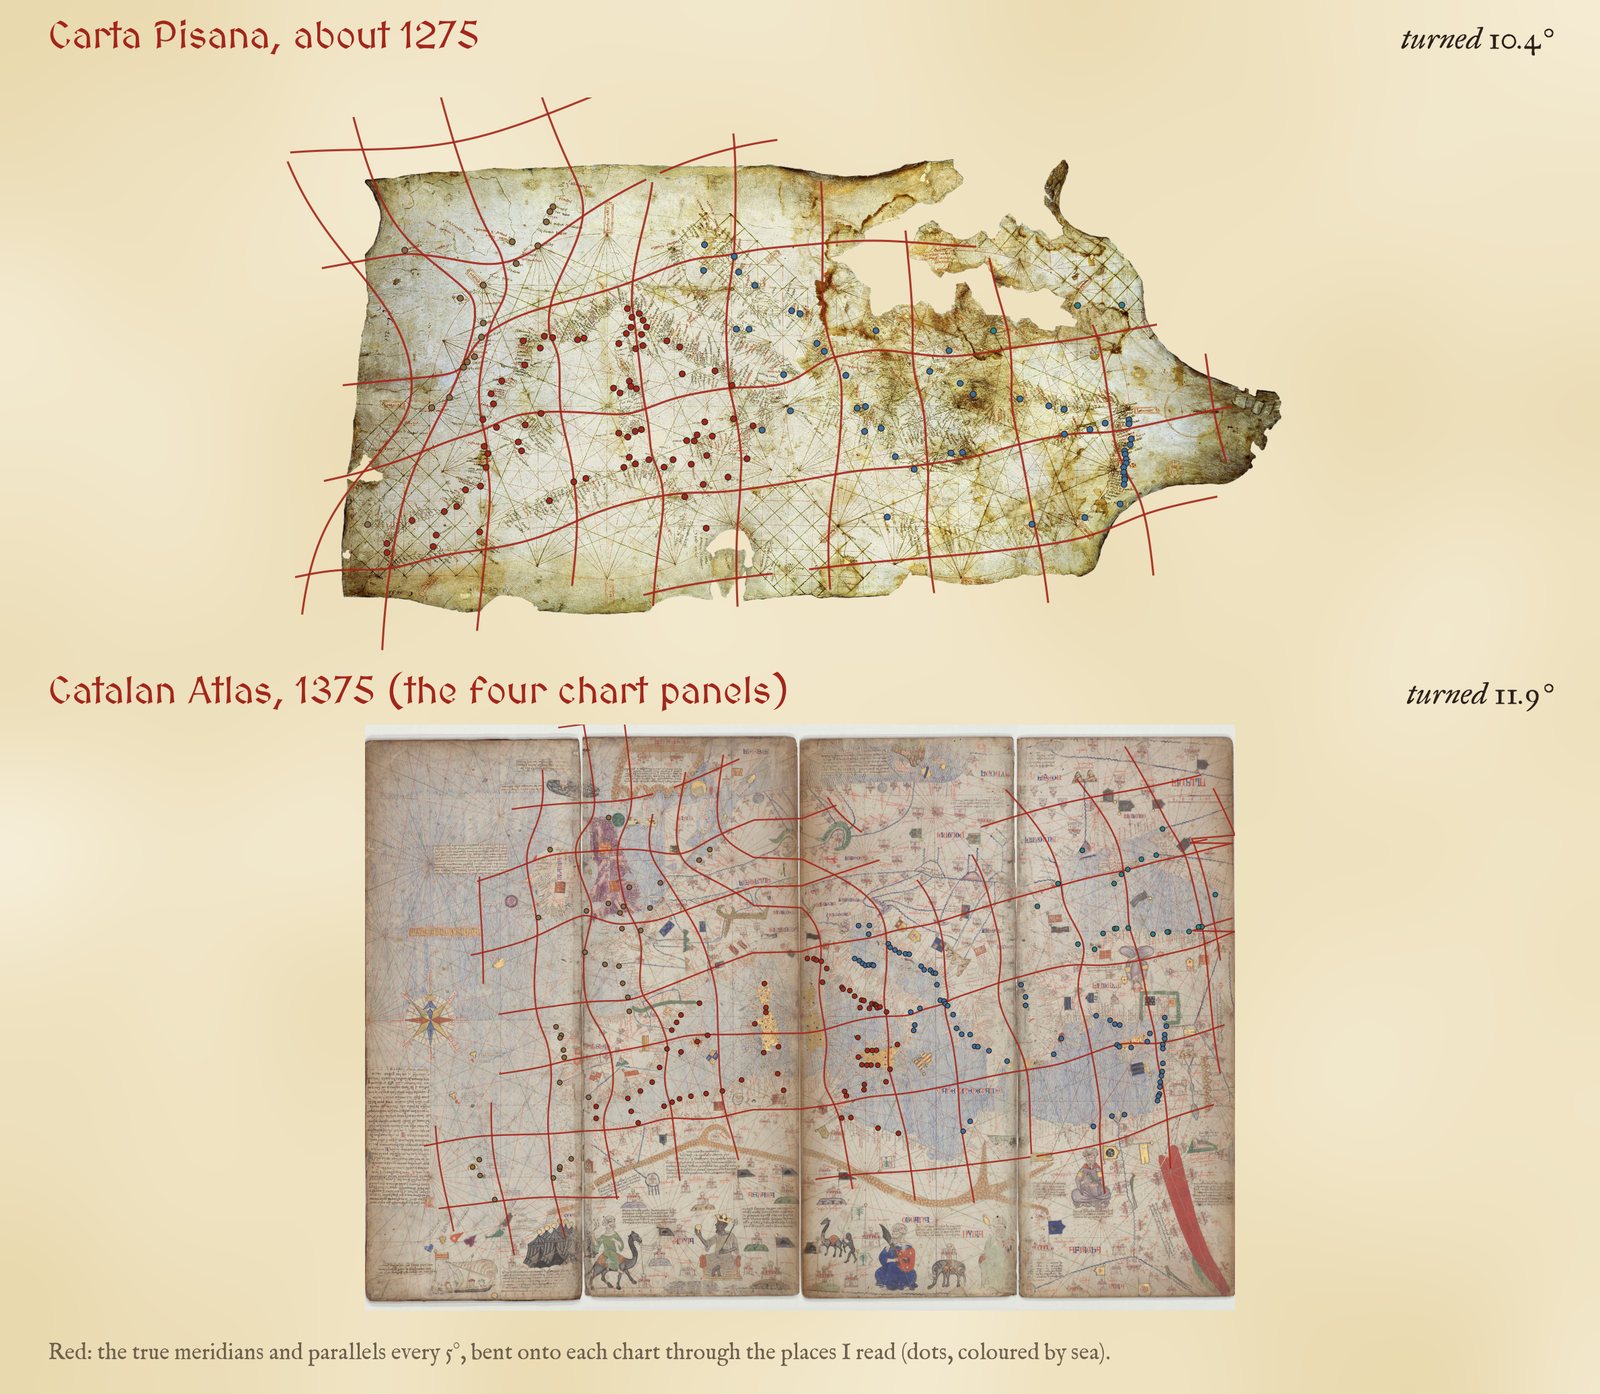
The distortion grid: the true 5 degree meridians and parallels, carried onto each chart by a smoothed thin-plate spline through my readings, within about 400 km of a place I read.
04 · Against older mapsPtolemy and Hereford
I have measured three other medieval and ancient world pictures the same way. Ptolemy's Geography of about 150 AD, a list of coordinates, puts its places a median 144 km out after the same kind of best fit, about 1.5 times the Pisana's 93 km, and region by region its Italy is 74 km out and its Greece 52 km, against 36 and 43 km for the Pisana's two basins. The Hereford Mappa Mundi, drawn within a few decades of the Pisana, misses by a median 516 km, but it was never meant to be a map in this sense. Al-Idrisi's world map of 1154 gets directions right to a median 10 degrees and its places within 55 km of their neighbours. Ptolemy covers a far larger world, so the comparison flatters the charts, but within the Mediterranean the portolans are a step change.
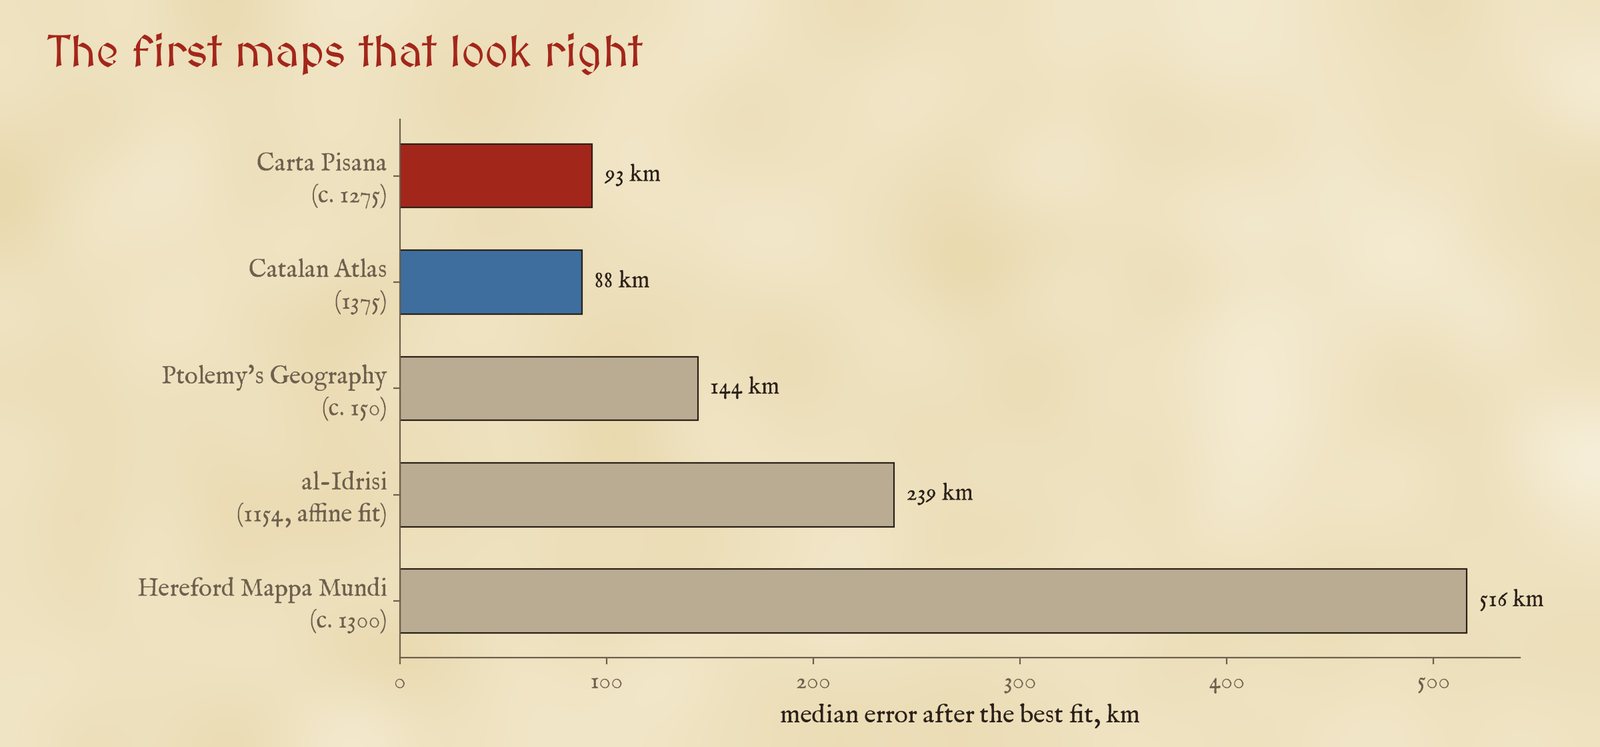
Median error after the best fit, from my studies of each map. The measures differ in detail (see the paper); the order does not.
05 · How I did thisReading by eye, fitting by numbers
Readings. There is no open table of control points for these charts, so I read them myself, on public domain scans of the originals from the Bibliothèque nationale de France on Wikimedia Commons. On the Carta Pisana the ink is badly faded, so I read 93 of the 148 places on Jomard's 19th-century facsimile and carried each one back to the original through 24 points where the compass lines meet, which can be found on both images, and 12 places I could read on both. Tested by leaving each of those places out, the transfer is accurate to about 37 km, which is part of the Pisana's local error. The Catalan Atlas chart is four separate panels. I placed them side by side, and because the scan of the third panel draws Corsica, Sardinia and the coast of Tunis again, I moved the two eastern panels 604 pixels west so that the repeated coasts line up. For each place I typed its modern position; 42% of Pisana readings and 62% of Catalan readings are clear or probable, the rest are certain places whose exact point I could not pin down.
Fits. For each chart I fitted the true positions, in several projections, to the chart positions with one scale, one turn and one shift (a similarity fit), and with a general affine fit; the errors are great-circle kilometres between each true place and where the fit puts it. The local error predicts each place from an affine fit to its eight nearest neighbours. The distortion grid is a smoothed thin-plate spline from true positions to the chart, drawn only within about 400 km of a place I read.
What this cannot say. The places are the ones I could read and identify, so they lean towards big harbours and clear headlands; the Pisana's Black Sea has only 3 readable places and is left out of the sea-by-sea figures. Identifications are mine. The scans are of uneven quality, and the Catalan Atlas folds hide part of the drawing; if instead the panels are allowed to slide freely the Catalan fit is no better (94 km). None of this changes the tilt or the gap between the Mediterranean and the Atlantic.
Sources and licences
- Carta Pisana, about 1275, Bibliothèque nationale de France, Cartes et plans GE B-1118 (RES). Scan on Wikimedia Commons, public domain (also on Gallica).
- E. F. Jomard, facsimile of the Carta Pisana in Les monuments de la géographie (1842 to 1862), Wikimedia Commons, public domain. Used only to read names.
- Catalan Atlas, 1375, attributed to Cresques Abraham, Bibliothèque nationale de France, Espagnol 30. Per-sheet scans on Wikimedia Commons, public domain (also on Gallica).
- Natural Earth (public domain): coastlines for the grid, the morph and the checks.
- My own studies of Ptolemy, the Hereford Mappa Mundi and al-Idrisi for the comparison.
- Base map: The Inked World (MIT code, CC BY 4.0 text), drawn live from OpenStreetMap vector tiles served by OpenFreeMap (ODbL) and AWS Terrain Tiles. MapLibre GL JS 4.7.1 (BSD 3-Clause). Fonts: MedievalSharp and IM Fell (SIL Open Font License).