Since 2001, every registered party in the UK has reported its larger donations to the Electoral Commission. When the donor is a company, a union or another organisation, the register also gives its postcode. I placed each of those postcodes in its 2024 constituency to see where the organisations that fund parties are based.
01 · WhereA few addresses
Between 2001 and 2026, companies, unions and other organisations gave UK parties £811m in today's money (38,469 donations from 5,451 organisations). That is 40% of the money in all reported donations; people gave 43%, and public funds made up most of the rest. Of the organisational money, 59% came from London addresses (95% interval 43 to 72%), against London's 11.5% of the seats. One constituency, Holborn and St Pancras, supplied 25%: several of the largest unions have their head offices there. The Cities of London and Westminster supplied 14% and Wimbledon 7%. The median constituency's organisations gave about £4,336 a year, and 40 had none at all.
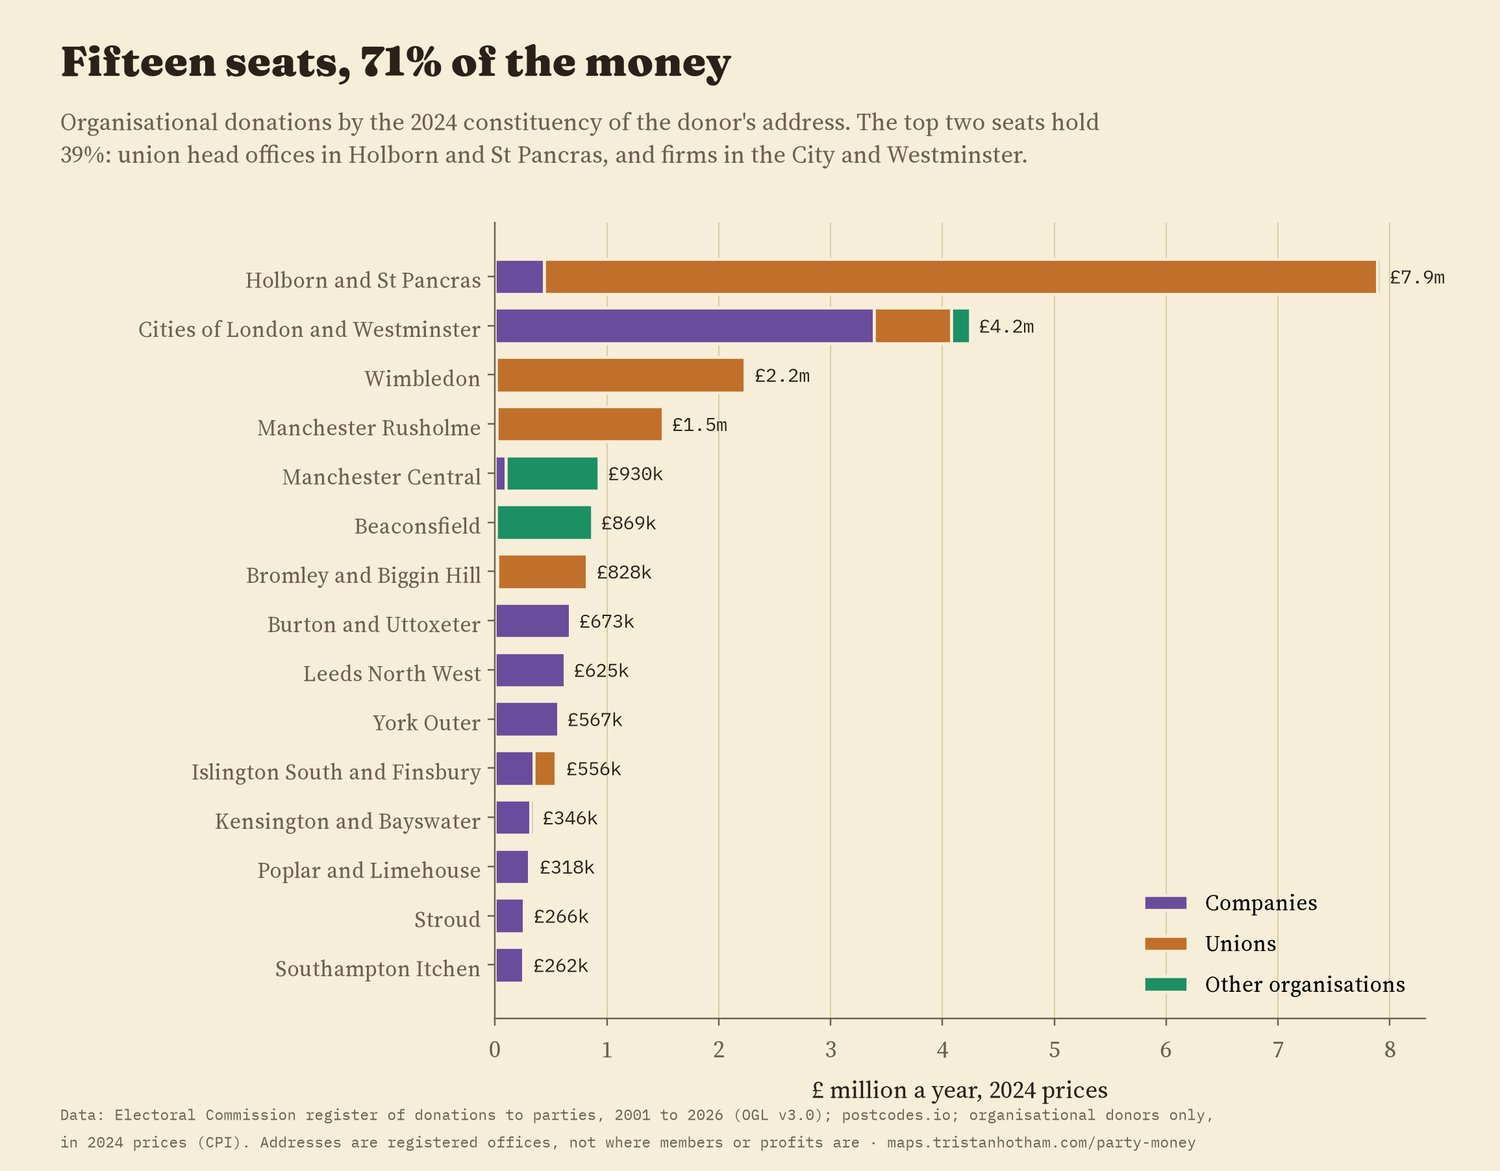
Organisational donations per year by the constituency of the donor's address, 2024 prices.
A postcode in the register is an address of record. For a union it is the head office, not the homes of the members who pay into its political fund. For a company it is the registered office, which can be far from its factories or shops. So this is a map of where funding organisations are based, not of where the money is earned.
02 · WhoUnions and companies
Unions and companies gave about the same: £345m from 111 unions and £342m from 3,738 companies. Their maps are very different. 86% of union money came from London addresses and the four largest unions gave 69% of it. Company money was more spread out: 46% from London. Part of the contrast is arithmetic: any 111 organisations drawn at random look almost as concentrated as the unions. Local associations, clubs and councillors' groups gave less, from much closer to home: 17% from London.
Because parties rely on different kinds of donor, their maps differ too. Unions gave 84% of Labour's organisational money, and 81% of it came from London addresses. Companies gave 82% of the Conservatives' and 70% of the Liberal Democrats', with 39% and 39% from London. Use the selector on the map to see each party's donors.
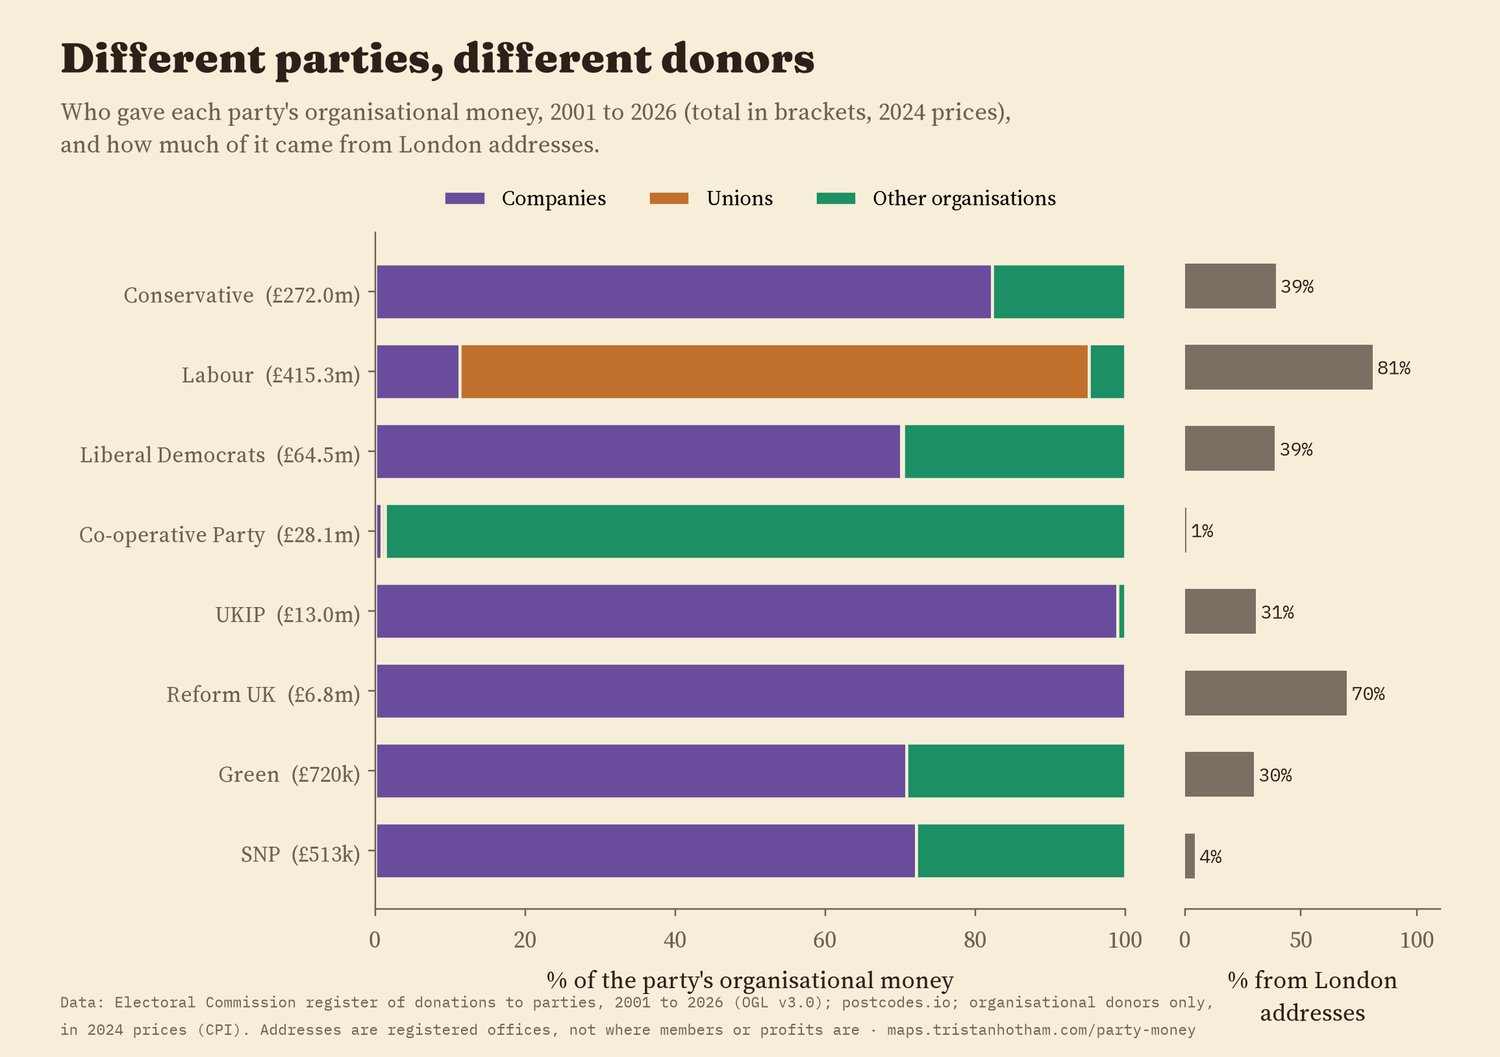
Who gave each party's organisational money, and how much came from London addresses.
03 · How farLocal money, local places
Most of this money goes to the central parties. But 1,352 local parties that I could place on the map also received organisational donations, and half of that money came from within 12 km. The local giving comes mostly from local associations and clubs (half within 4.5 km); companies gave from a little further (half within 19 km), and unions mostly from their head offices (205 km). Without local associations, the median distance rises to 35 km.
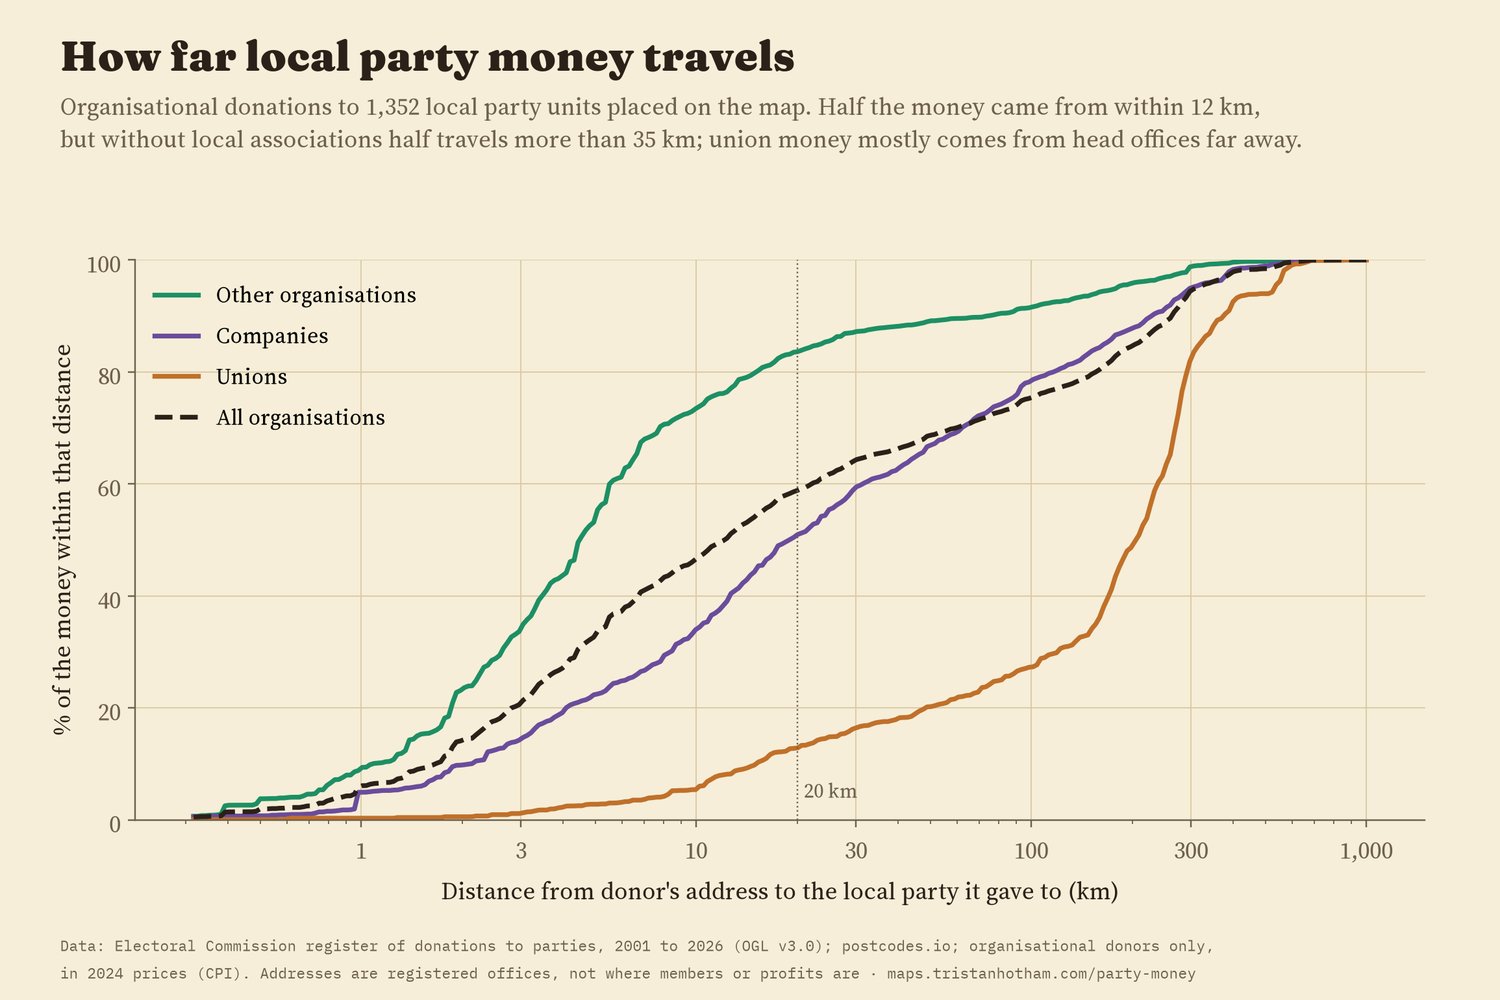
Share of the money given to local party units from within each distance of the donor's address.
London's share has fallen a little over time, from 68% in the 2001 to 2005 Parliament to 47% in 2019 to 2024. The trend is only just distinguishable from no change (odds ratio 0.88 per Parliament, 95% interval 0.78 to 1.00) and comes mostly from a changing mix of donors.
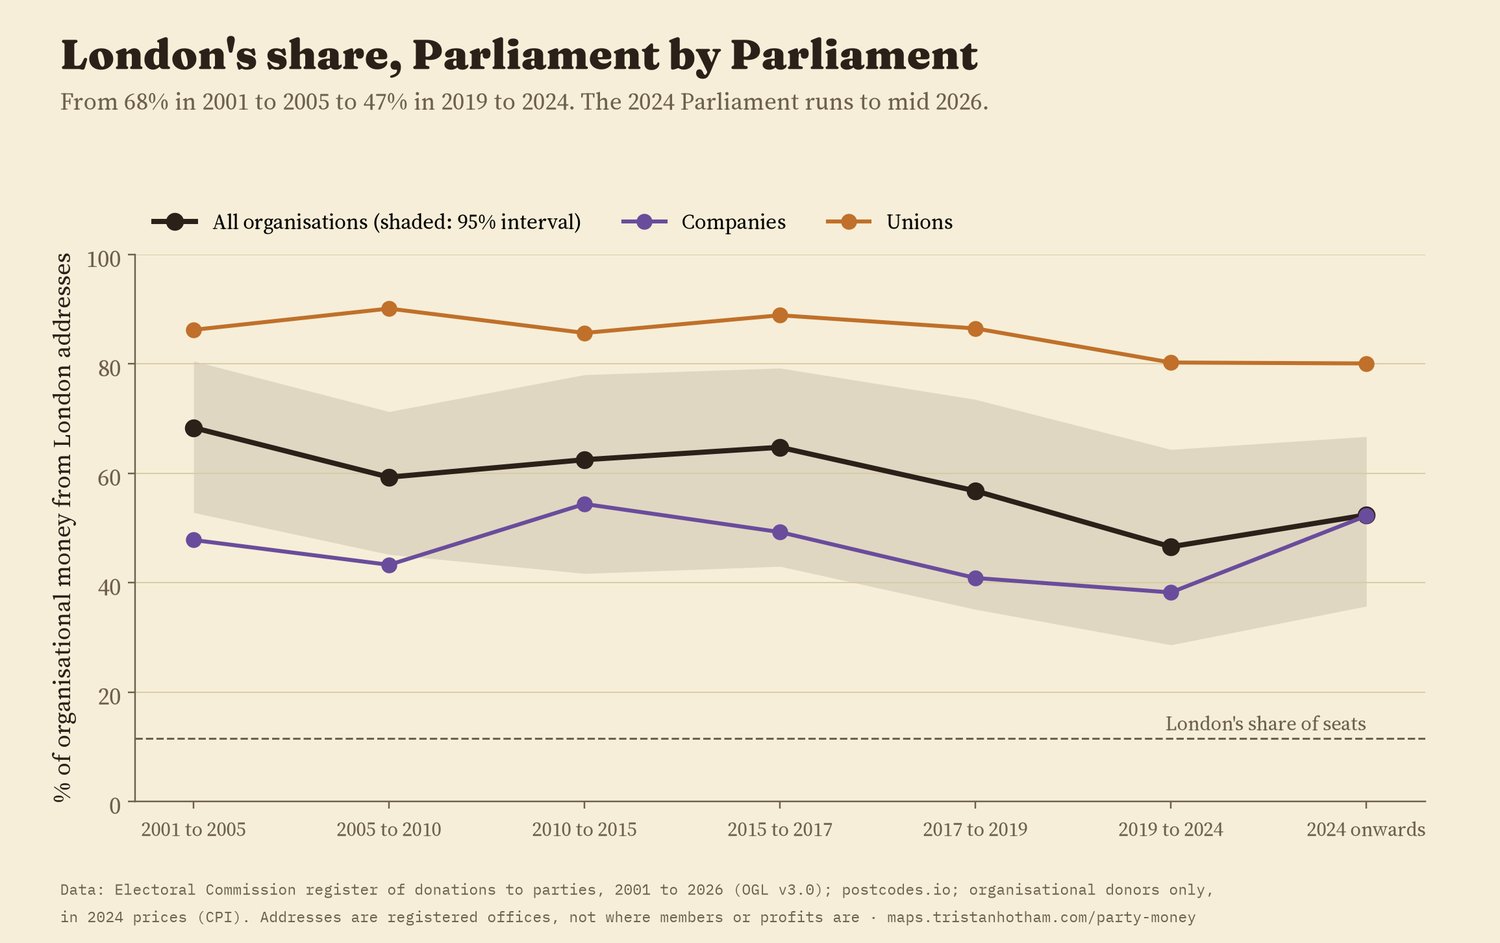
London's share by Parliament, with a 95% interval.
04 · How I did thisFrom register to map
The register. I used every accepted donation to a registered party in the Electoral Commission's register, 2001 to 2026, without returned or impermissible donations, and converted values to 2024 prices with the consumer prices index (2025 and 2026 kept at 2024 prices). Organisations are companies and partnerships, unions, and other organisations: unincorporated associations, friendly societies and trusts. Public funds such as parliamentary support for opposition parties are left out.
Places. Each donor postcode was looked up with postcodes.io and placed in its 2024 constituency; old postcodes were placed by their recorded coordinates. Local parties were placed by their names. I wrote the analysis plan before computing any of the results, and the paper reports every planned check, including the one that did not hold.
Privacy. People who give to parties have no address in the register and are never mapped or named here. Only companies, partnerships and unions are named in the map's popups. The published data give postcode districts, not full postcodes.
What this cannot say. It maps addresses of record, not where members, workers or profits are. It leaves out donations from individuals, which are the largest share, and anything below the reporting thresholds.
Sources and licences
- Electoral Commission, Search the register of donations, retrieved 2026. Contains public sector information licensed under the Open Government Licence v3.0.
- Postcode lookups: postcodes.io (ONS and Ordnance Survey data, Open Government Licence v3.0; Royal Mail data).
- 2024 constituency boundaries: ONS via voteReproject (Horan, Domijan and Brunsdon 2025, MIT), as prepared for an earlier study of mine.
- Prices: OECD consumer price index for the UK (2015 = 100), via FRED, series GBRCPIALLAINMEI.
- Base map: OpenFreeMap Positron style (OpenStreetMap, ODbL). MapLibre GL JS 4.7.1 (BSD 3-Clause).
- Text, figures and data CC BY 4.0 (register data OGL v3.0); code MIT.