Ino's Japan
In 1800, at the age of 55, a retired sake brewer called Ino Tadataka set out to measure Japan on foot. Over 17 years and about 35,000 km his teams paced and chained the coasts and roads, and in 1821 the survey became the first map of the whole country drawn from measurement. How close did he get? I put 28 sheets of his large-scale map back on a modern map to find out.
Most old maps in this series are wonderful and wrong. This one is the opposite. Ino Tadataka married into a sake brewing family in Sawara, east of Edo, ran the business for decades, and only after retiring went to Edo to study astronomy. From 1800 he led a series of surveys that walked the coast of Japan with measuring chains, compasses and a quadrant for the stars, fixing latitudes at night and distances by day. He died before the map was finished; his team completed it in 1821: 214 large sheets at 1:36,000, with the far north at 1:43,600, plus medium and small versions.
The Library of Congress holds a manuscript copy of the large sheets, and Wikimedia Commons has photographs of sheets 1 to 40. Those 40 sheets, 18.7% of the whole, are what this study uses. They all show the far north: Hokkaido, the southern Kurils and a strip of Sakhalin. I found where each sheet belongs by matching its drawn coastline to the modern one, then measured how far the drawn coast and 93 control points sit from where they really are. Pick a sheet below to see it beside today's map.
01 · Sheet by sheetThe survey and the coast today
Left: the sheet in its own pixels, with its control points (open circles: capes I picked by eye; dots: coast windows matched automatically). Right: the sheet laid on the modern map by the coastline fit (change its opacity in Map layers), with today's coast drawn on top in teal and arrows from where the sheet puts each control point to where it really is. Coloured boxes: the other located sheets; click one to switch. Sources: Library of Congress, Geography and Map Division (public domain, via Wikimedia Commons); Natural Earth.
02 · How closeWithin a few hundred metres, sheet after sheet
To measure a sheet I kept its scale fixed at the nominal 1:43,600 and allowed it only one shift and one turn, the best that lays its drawn coast on Natural Earth's modern coast. Then I measured, every kilometre along the drawn coast, how far it lies from the modern line. On a typical sheet the median gap is 280 m; 69% of its coast is within 500 m and 90% within a kilometre. On the paper that is about 6.4 mm. The closest sheet, number 26 (Hidaka-Monbetsu), is a median 108 m out; the furthest, number 25 (Shizunai), 651 m. 15 of the 28 sheets are under 300 m.
Gap between each sheet's drawn coast and today's coast
Median distance, in metres, from points every kilometre along the drawn coast to Natural Earth's coast, after one shift and one turn per sheet. Coloured by region. Hover or tap a bar; click to open the sheet.
That gap is an upper bound on Ino's error, not a measure of it. Three things add to it besides the survey: the copyists who made the Library of Congress set, the paper's shrinking and folding, and above all the modern line itself. Natural Earth's 1:10m coast is drawn for maps of whole countries; it smooths away small bays and spits, and in places it is several hundred metres from the real shore. A better modern coastline would shrink these numbers, never grow them.
03 · Control pointsCapes, spits and bends
A coastline fixes position across the shore but not along it: a straight beach can slide without the gap changing. For position in both directions I used control points. I picked 23 capes, spit tips and bends by eye where the sheet and the modern line both show the same feature, and the fit found 70 more automatically: stretches of 8 km of drawn coast that curve enough to be matched to the modern coast without sliding. That is 93 in all, on 16 sheets, well short of the 250 I aimed for: Hokkaido's long smooth beaches and the generalised modern coast leave few features that can be matched with confidence.
Measured against each sheet's coastline fit, the control points lie a median 543 m from their true positions; 72% are within a kilometre. Cape Nosappu, the easternmost point of Hokkaido, is 585 m out; Cape Notoro 531 m; the tip of the Notsuke spit 306 m. The largest is Cape Erimo, 2,702 m, where the sheet draws the point running further out to sea than the modern outline does.
How far the coast and the control points lie from the modern positions
Red: share of all drawn coast points at each distance from today's coast. Blue: the 93 control points. 100 m bins; the last bin includes everything beyond.
Do the sheets bend as well as shift? On the 10 sheets with at least four control points, a fit with one shift, one turn and one scale predicts a left-out point to a median 508 m. Allowing a full affine stretch, on the 6 sheets with six or more points, does no better (536 m against 536 m for the simpler fit on the same sheets), and a curved, second-order fit, possible on only 2 sheets, does worse (824 m against 448 m). Within a sheet, the control points show no distortion beyond their own noise.
04 · DistortionSquare to north, true to scale
Each sheet's best turn says how far its north is from true north. On the 15 sheets whose coast curves enough to fix the angle, the median tilt is 0.9 degrees and 12 are within two degrees, from -1.9 to 7.3. The scale holds too. Calibrated on one sheet (Notsuke), the best-fitting scale of the 6 sheets with six or more control points ranges from 0.95 to 1.03 times the nominal: the sheets agree with each other to within 5%.
Tilt from true north, sheet by sheet
Rotation of the best fit, in degrees; filled dots are sheets whose coast fixes the angle well, open dots straight coasts where it is loose. Hover a dot.
Every sheet, measured
Click a row to open the sheet above. Gap: median distance of the drawn coast from today's; points: control points; error: their median distance from the true positions.
05 · The whole countryLatitude, longitude and the 1878 map
The large sheets have no grid of latitude and longitude, so they cannot say where Ino put Hokkaido as a whole. For that I used a map of the whole of Japan published by the Army General Staff in 1878 and compiled from Ino's survey. I picked 18 capes and island centres on it, from Tsushima to Todoga-saki, the easternmost point of Honshu, and laid it on a modern map with the best shift, turn and scale. The median point is 7.9 km from its true position, 16.1 km at most (Ashizuri-misaki).
The 1878 map, with each point's error
Arrows run from the map's position to the true one, drawn ten times longer. Hover a point.
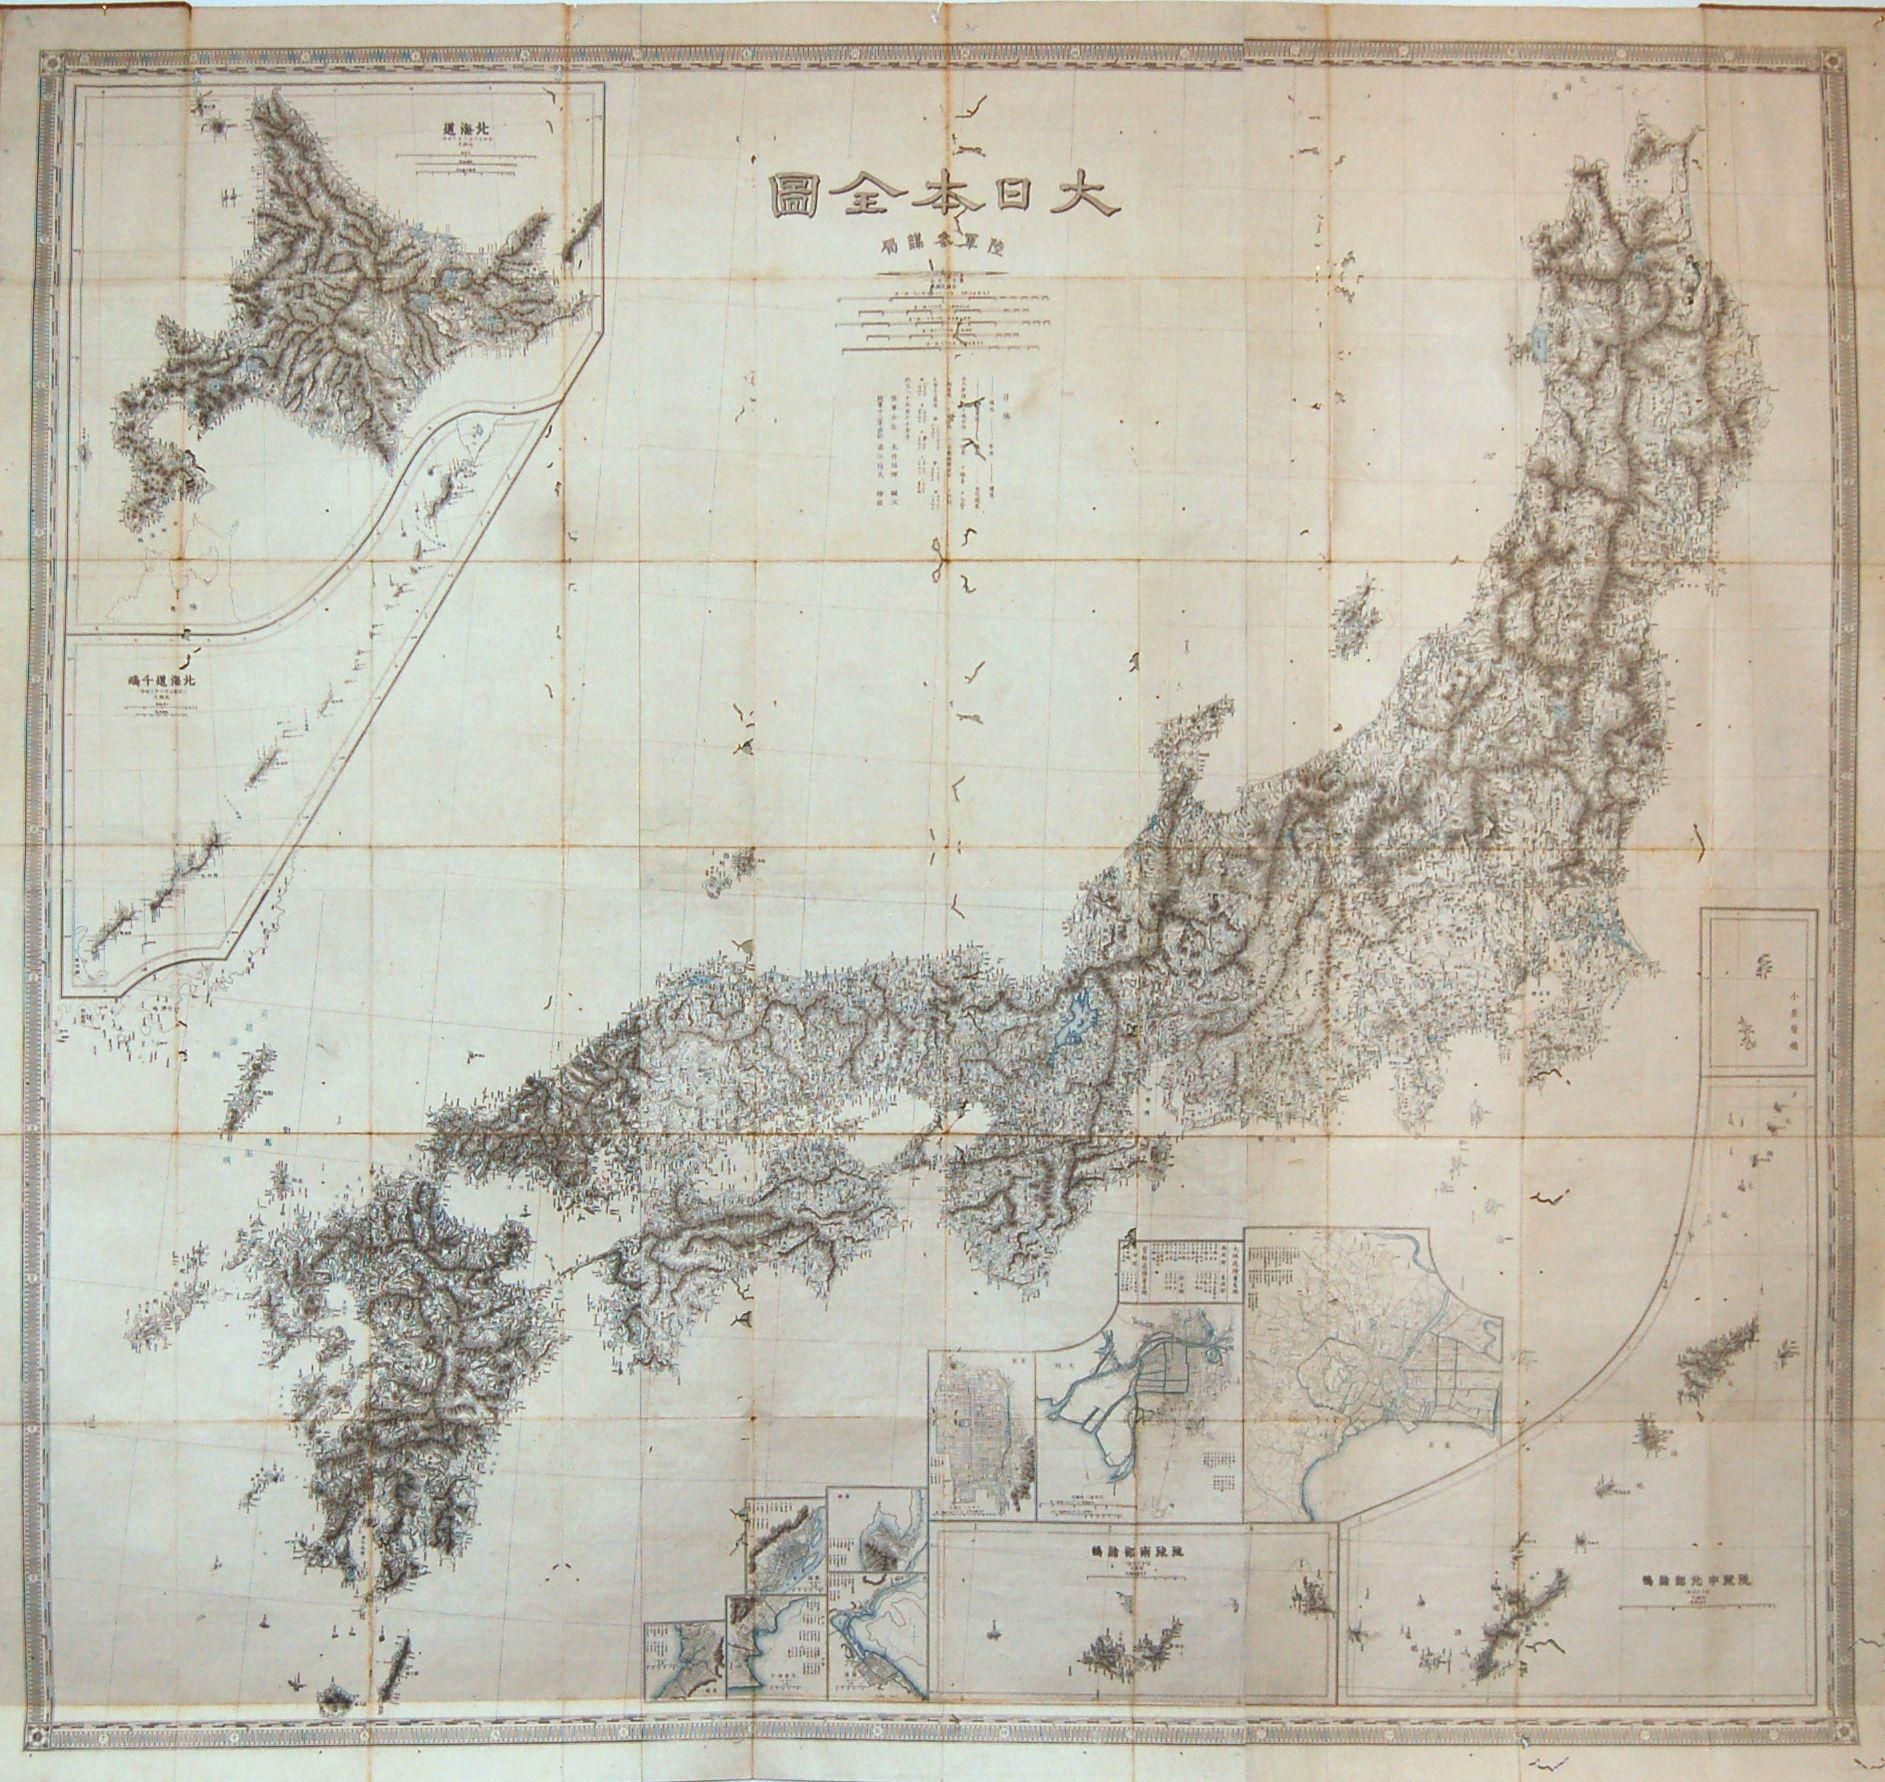
Ino fixed latitudes by the stars and worked longitudes out from his traverses, so the story goes that his north and south were good and his east and west drifted. At this scale I cannot see that. The north-south errors (root mean square 6.2 km) and east-west errors (7.1 km) are the same size, about 2.4 and 2.0 minutes of arc on a typical point, and both are close to what my picking on a 0.75 km-per-pixel image can resolve (three pixels is 2.3 km). The one hint is a stretch: if east-west and north-south scales are fitted separately, east-west distances come out 1.9% longer (95% interval 0.1 to 3.8%). Across the length of Japan that would add up to tens of kilometres, but it could equally come from the projection the 1878 compilers chose, which I cannot read at this resolution.
East-west and north-south errors across the country
Error of each point after the best shift, turn and scale, in km, against its longitude. Hover a point.
06 · What is here40 sheets of 214
This is a small and particular slice of the map. The 40 sheets are the first in the set's numbering and all show the far north, at the smaller Hokkaido scale. None shows Honshu, Shikoku or Kyushu, where Ino surveyed most densely, so the results say nothing directly about the 1:36,000 sheets of the main islands. Of the 40, I placed 28; 8 are unfinished pencil drafts of inland routes, and the rest are almost blank or show too little coast to place with confidence. Ino walked Hokkaido's Pacific coast himself on his first survey in 1800; much of the rest of the north on the finished map, including the Kurils and Sakhalin, is usually credited to the surveyor Mamiya Rinzo, so these sheets measure Ino's map rather than only his own legs.
07 · How I did thisMethods and caveats
The sheets. Photographs of sheets 1 to 40 of the Library of Congress manuscript copy, from Wikimedia Commons, reduced to 3,840 pixels wide. I picked out the drawn coast by colour: dark or red ink lines next to the green hachures that mark land, in strokes long enough not to be labels.
Placing the sheets. A brute-force search tried every position, a range of turns and three scales for each sheet and scored how well its land and sea fell on modern land and sea; I checked the best placements by eye and kept 28. Each was then fitted to Natural Earth's 1:10m coast by iterative closest point, allowing one shift and one turn with the scale fixed. The scale comes from one sheet (Notsuke, whose hooked spit fixes it) and is carried to the others by the known size of each photograph.
Control points. 23 capes, spit tips and bends picked by eye on the sheet and on the modern outline, and 70 stretches of drawn coast, 8 km across, matched to the modern coast by a local shift where the coast curves enough to fix the shift in both directions. Their errors are measured against each sheet's coastline fit, which does not use them.
The 1878 map. 18 points picked by eye on a 1,885 pixel photograph, fitted by the best shift, turn and scale on a conformal projection; errors are split into north-south and east-west parts.
What this is not. A measure of Ino's survey alone: the errors include the copy, the paper, the photographs, my picking and, most of all, the generalised modern coast. A test of the main islands: there are none in this set. A test of absolute position: the large sheets carry no latitude and longitude, so each is fitted on its own.
Sources and licences
- Ino Tadataka and team, Dai Nihon Enkai Yochi Zenzu, large-scale sheets 1 to 40, manuscript copy, Library of Congress Geography and Map Division (item 2001620020). Public domain; photographs via Wikimedia Commons.
- Dai Nihon Zenzu, Army General Staff Bureau, 1878. Public domain, via Wikimedia Commons.
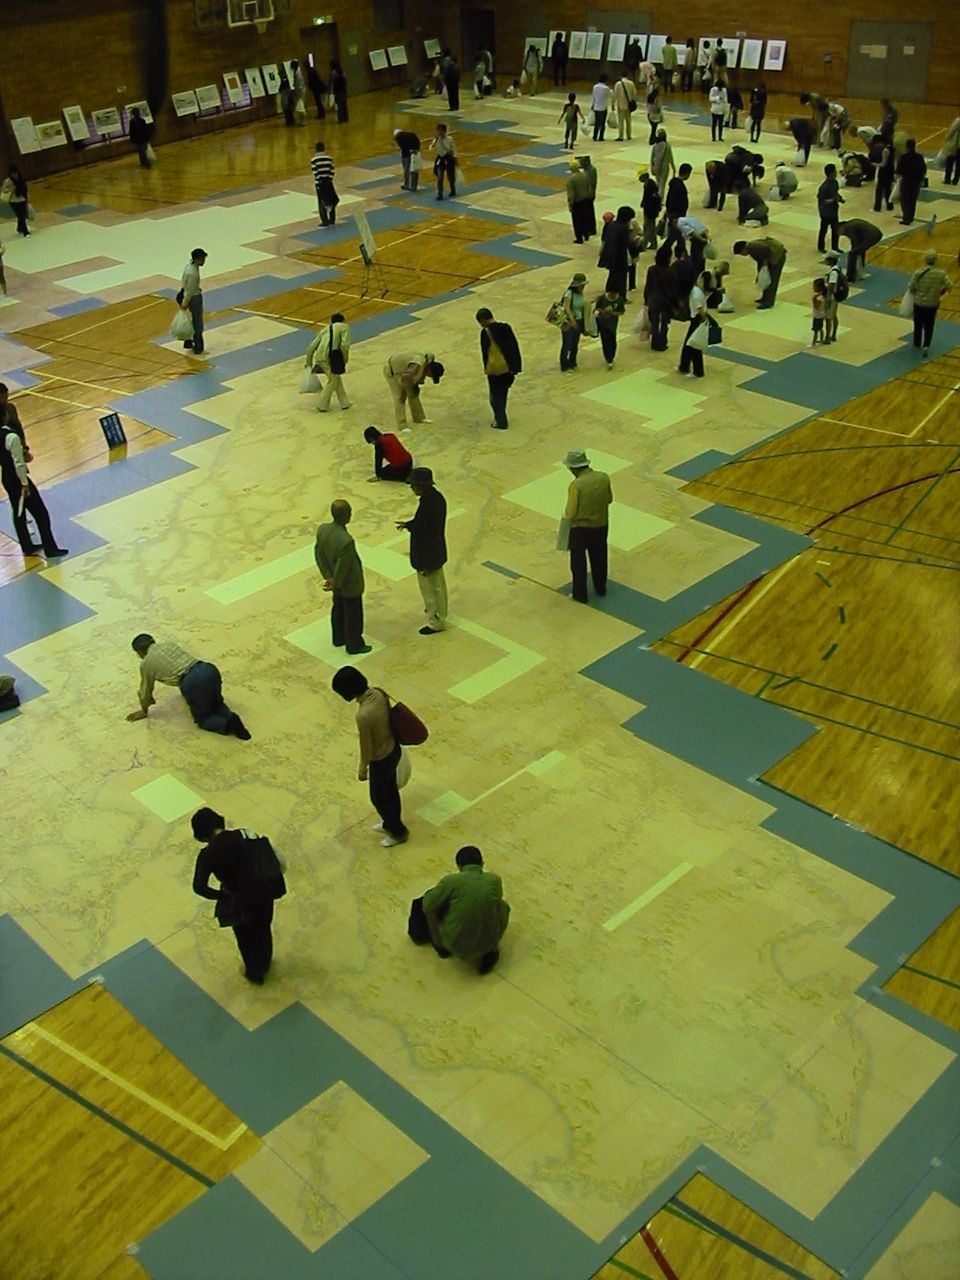
- Replica photograph: Wikimedia Commons, "Inoh taizu 01.jpg".
- Natural Earth 1:10m and 1:50m countries (public domain). Optional shaded relief tiles © Esri.