When a disaster takes lives, the place where it happened often becomes a name the whole country knows. I wanted to know how much the House of Commons talks about such a place afterwards, how long that lasts, and whether it depends on how many people died or on where the disaster happened. I counted, month by month, the Commons speeches that named the place of 64 disasters in the UK between 1910 and 2020, in which 4,346 people died.
01 · The rise and the fadeNoticed at once, then less and less
In the month of a disaster, Commons speeches naming the place rose to 10.4 times their usual level (95% interval 2.4 to 44.9), and to 8.3 times the month after. By the fourth month the rise was about 3.0 times. From the second year to the fifth it sat at about 1.8 to 2.2 times the usual level, and the intervals all include no change. In the two years before, the counts were flat, so the rise is not a trend that was already under way.
For each disaster I also asked how long it took to reach half of all the extra attention over five years. The median was 8.5 months; for 31 of the 54 disasters with any extra attention it was within the first year. A few cases kept Parliament's attention much longer, usually because an inquiry, a trial or a campaign by families followed: Grenfell Tower reached half only after 23 months, Piper Alpha after 28, and Gresford after 29.
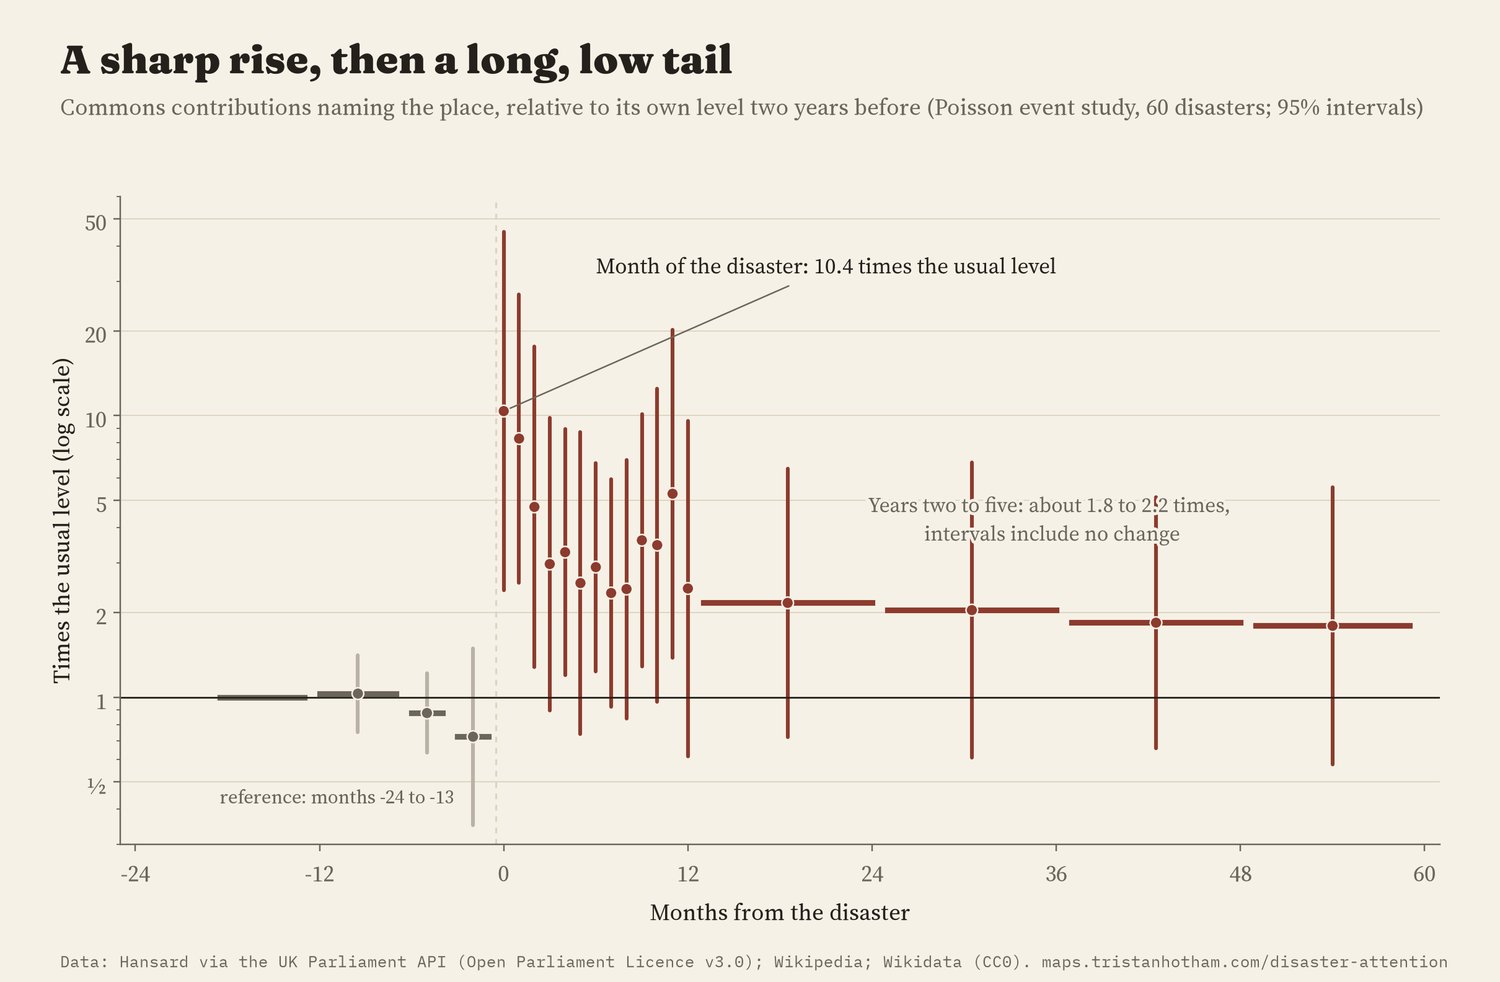
Ratios from a Poisson event study of 60 disasters, with 95% intervals.
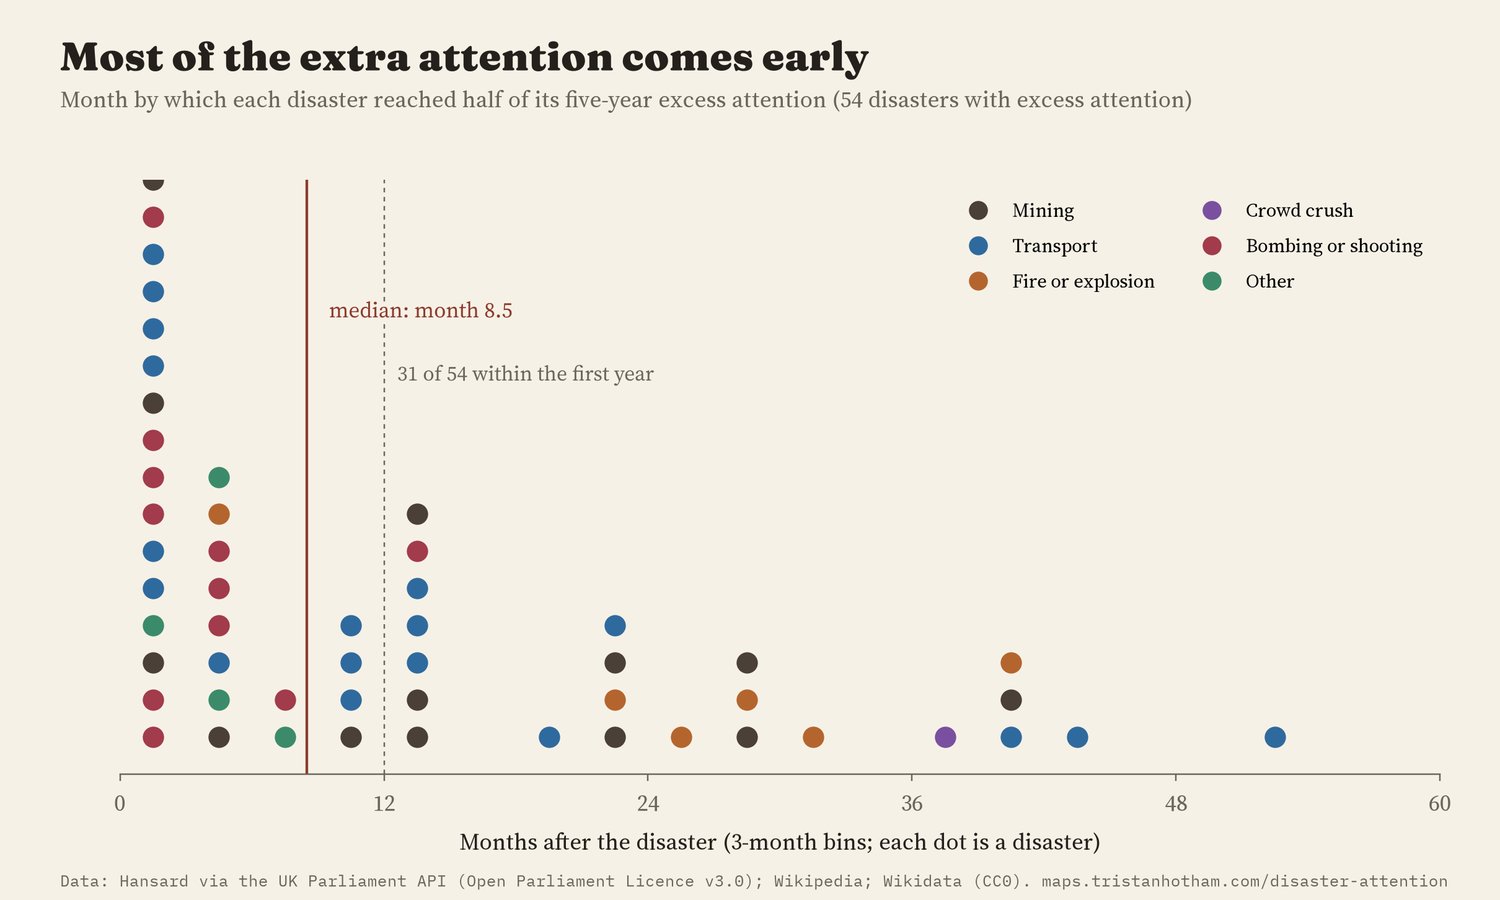
Each dot is a disaster with any extra attention.
02 · The death tollMore deaths, only a little more talk
Across all the disasters, the raw link between deaths and attention is close to nothing (rank correlation -0.06). Some disasters with many deaths left almost no trace in the searchable record: the 439 deaths at Senghenydd in 1913 and the 226 at Quintinshill in 1915 produce 1 and 0 matching contributions, partly because older volumes are harder to search and wartime reporting was restricted. Others with few deaths were discussed again and again: the derailment at Grayrigg in 2007, in which one person died, came up in 22 contributions.
The analysis plan, written before I looked at the results, compares disasters with the same usual level of mentions, the same kind and era, and the same type of search word. In that model, twice the deaths goes with about 33% more attention over five years (95% interval 3% to 72%): more, but much less than in proportion. This link is not robust. Its interval includes zero in 12 of the 28 checks I set out in advance, and shuffling the death tolls at random gives a link at least as strong in 7% of draws. A placebo test, which pretends each disaster happened three years earlier, finds nothing (0.01).
Those are the first results, for 64 disasters. Afterwards I found usable search words for 22 more that I had left out, and added them under the same rules (the dark outlines on the map). With all 86, twice the deaths goes with about 44% more attention (95% interval 9% to 90%), and shuffling the tolls gives a link that strong in only 0.7% of draws. The link is a little clearer, but still not robust: its interval includes zero in 10 of the 28 checks. Because I added these disasters after seeing the first results, I show both versions.
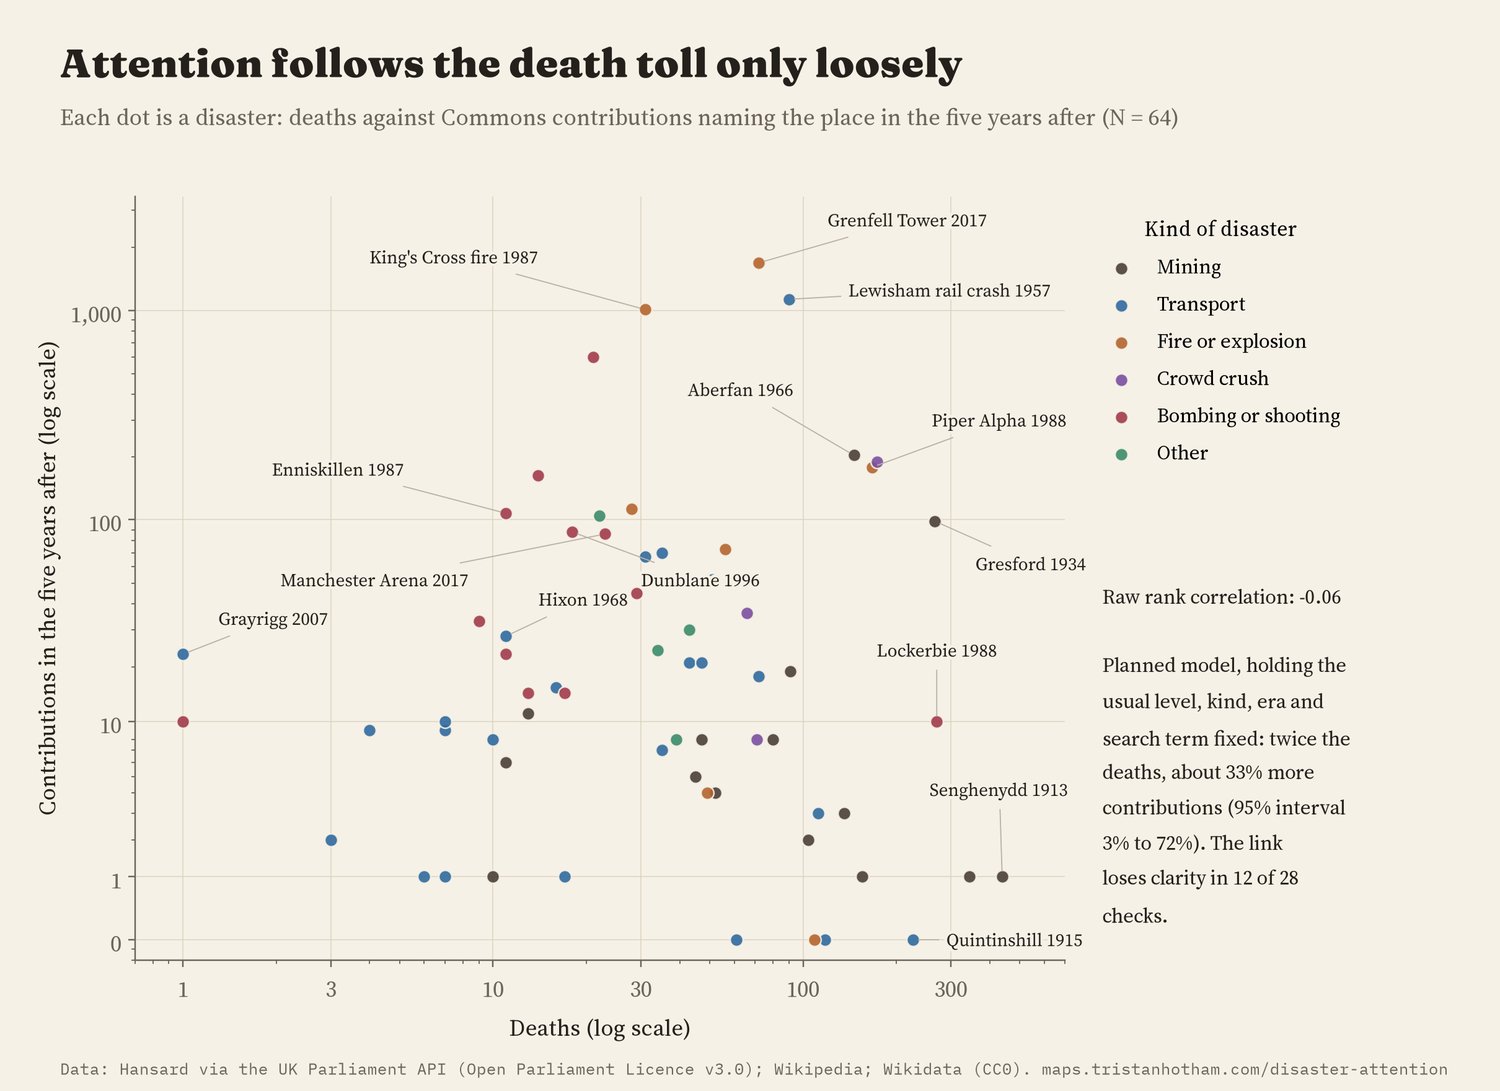
Each dot is a disaster, coloured by kind.
03 · Whose disasterLondon's lead rests on two disasters
With the same deaths, kind and era, disasters in London and the South East drew 3.5 times the attention of those elsewhere in England (95% interval 20% to 947% more). But that gap rests on two London disasters: leave out Grenfell Tower and the King's Cross fire together, or use the other search word where one exists, and the difference shrinks to about 39% with an interval that includes no difference. Disasters in Scotland, Wales and Northern Ireland were not clearly treated differently from those in England, and mining disasters were not clearly different from other kinds. The data are too thin to say more than that.
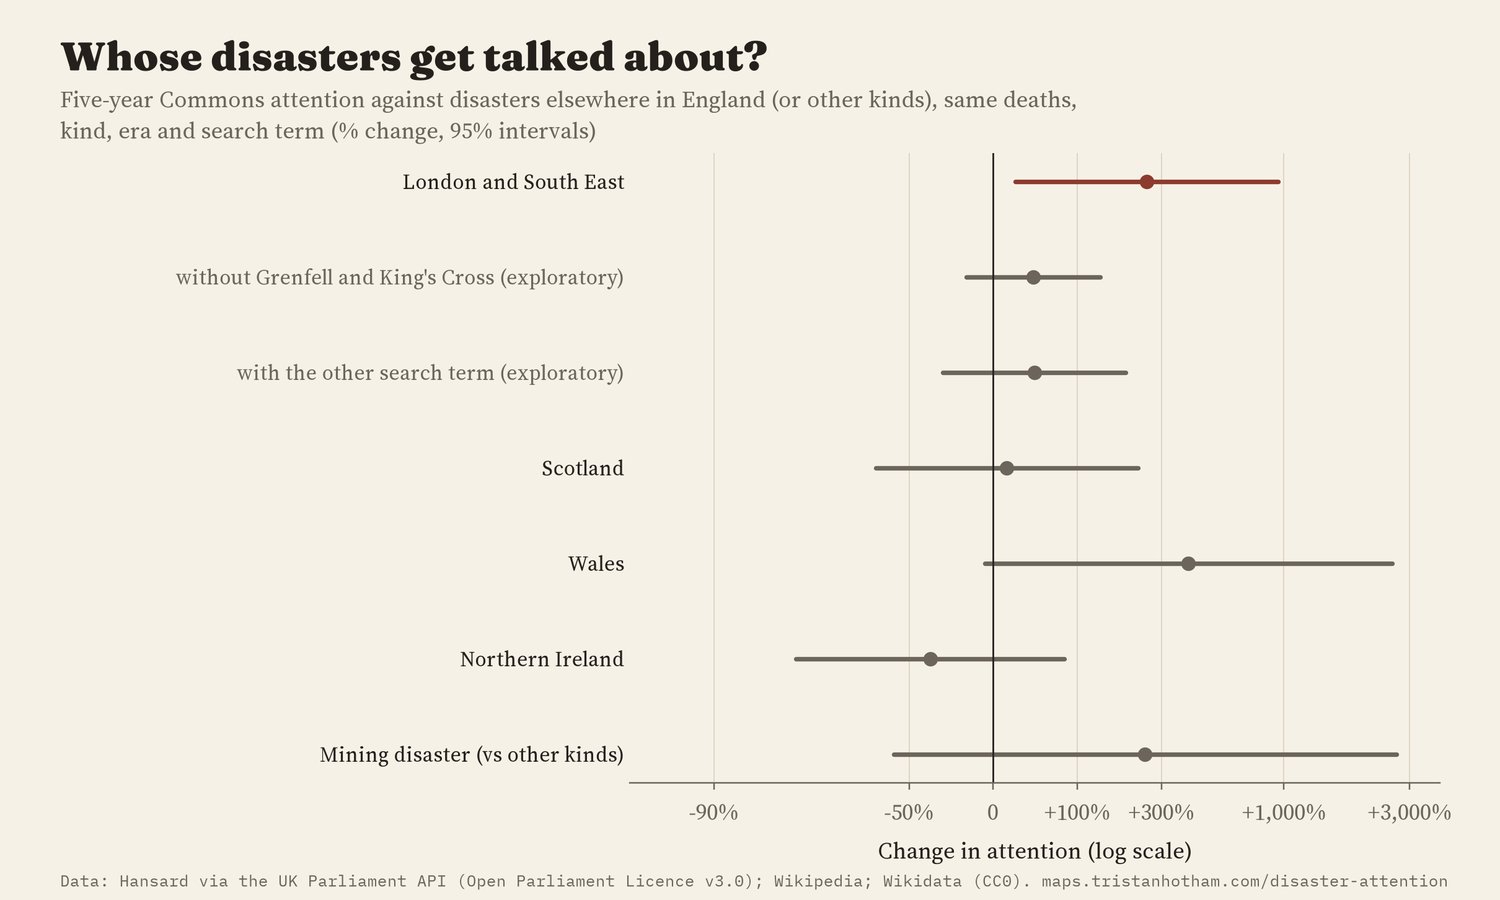
Changes in five-year attention from the planned model, with two exploratory checks.
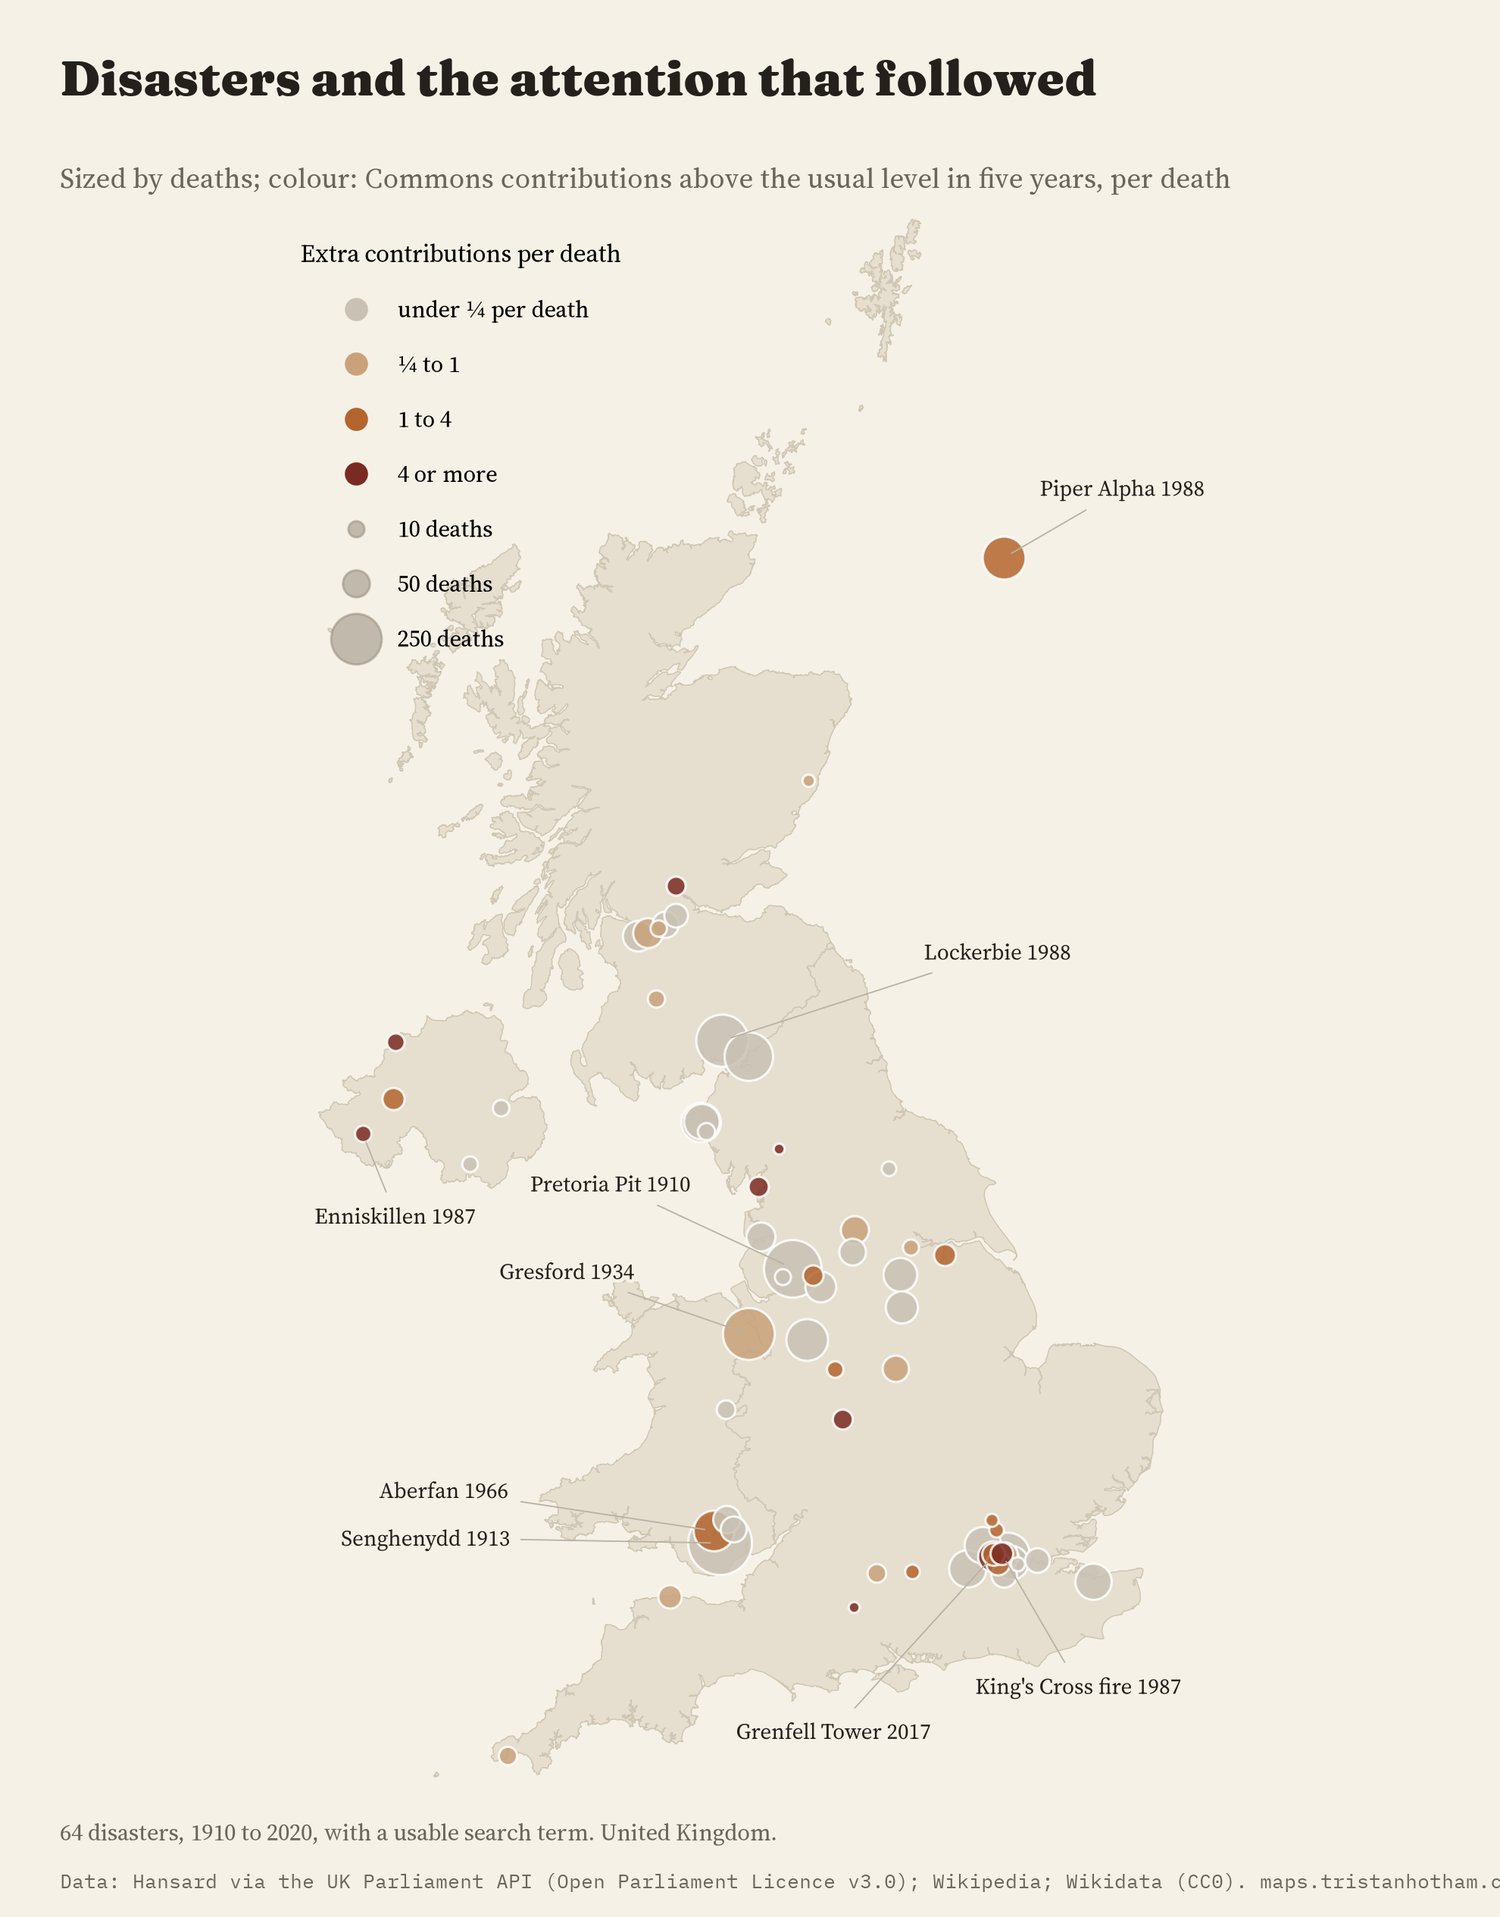
The map above, as a still.
04 · What is rememberedA list is already a memory
Any list of disasters is a filter of what has been remembered. The Wikipedia list keeps disasters with 40 or more deaths; smaller ones are here only if Wikidata or the list of search words I started from included them, and those were chosen because people still talk about them. That shows: the 23 smaller disasters that came from the search list had a median of 11 deaths but were often much discussed, which flattens the link with the death toll. Among the 31 disasters on the Wikipedia list alone, the link is much steeper (elasticity 2.0), an exploratory result I did not plan.
The search word matters too. People say "the Lockerbie bombing" more than "in Lockerbie": the phrase "in Lockerbie" appears 10 times in the five years after 1988, the word "Lockerbie" 239 times. Some words also mean other things. Hillsborough is a castle in County Down and the name of a 1985 agreement, so I left it out of the main analysis; "King's Cross" was also in debates about the Channel Tunnel railway in the same years, which I noticed only after the results were in.
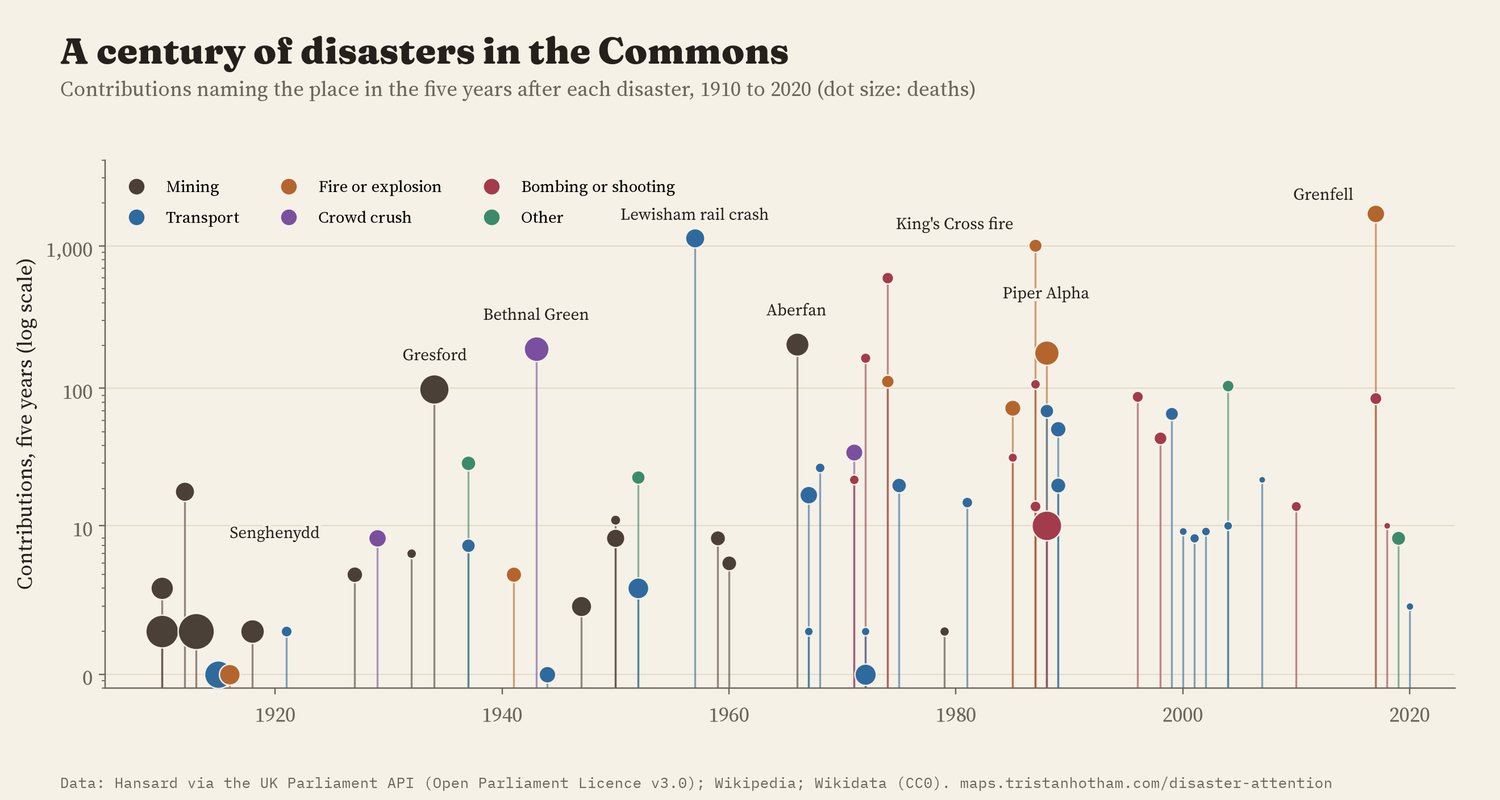
Contributions in the five years after each disaster, by year.
05 · How I did thisCounting speeches, month by month
The disasters. I started from the Wikipedia list of disasters in Great Britain and Ireland by death toll, Wikidata's disasters in the UK, and a list of place words for well-known disasters. I kept single, local events on UK soil since 1909 with at least one death, and left out pandemics, heatwaves, smogs, losses at sea and events abroad. At first 39 candidates could not be used, most because no search word was available. After a second search for words, 13 remain, for example where the only word is too broad ("Gatwick", "London Bridge", "7 July"); they are rings on the map.
The counts. For each disaster I counted Commons speeches each month that contained "in" plus the town's name, or the name of the pit, station or village itself, from two years before to five years after, using the UK Parliament's Hansard search. The usual level is the average of the two years before, adjusted for how much Parliament was sitting and for the growth of Hansard.
The models. The plan was written down before any model was run: a Poisson regression of five-year attention on the death toll, the usual level, the kind of disaster, the era and the type of search word, then 28 planned checks and a placebo. Exploratory checks are labelled as such.
What this cannot say. It counts words, not care or action. A short list of speeches can matter more than a long one, and much of the response to a disaster happens outside the chamber, in inquiries, courts and communities. It is a comparison, not an experiment.
All 86 disasters in the analysis (* added later)
| Disaster | Year | Deaths | Search word | Usual a month | Five years |
|---|---|---|---|---|---|
| Wellington Pit disaster | 1910 | 136 | Wellington Pit | 0.00 | 3 |
| Pretoria Pit disaster (Hulton Colliery) | 1910 | 344 | Pretoria Pit | 0.00 | 1 |
| Cadeby Main pit disaster | 1912 | 91 | Cadeby | 0.00 | 18 |
| Senghenydd colliery disaster | 1913 | 439 | Senghenydd | 0.00 | 1 |
| Quintinshill rail crash | 1915 | 226 | Quintinshill | 0.00 | 0 |
| Faversham gunpowder mill explosion | 1916 | 109 | in Faversham | 0.00 | 0 |
| Low Moor explosion * | 1916 | 40 | Low Moor | 0.00 | 0 |
| Minnie Pit disaster | 1918 | 155 | Minnie Pit | 0.00 | 1 |
| Chilwell shell filling factory explosion * | 1918 | 137 | Chilwell | 0.00 | 7 |
| Abermule train collision | 1921 | 17 | Abermule | 0.00 | 1 |
| R38 airship crash (Hull) * | 1921 | 44 | R.38 | 0.08 | 2 |
| Marine Colliery disaster (Cwm) | 1927 | 52 | in Ebbw Vale | 0.00 | 4 |
| Glen Cinema disaster | 1929 | 71 | in Paisley | 0.17 | 8 |
| Bentley Colliery disaster * | 1931 | 45 | Bentley Colliery | 0.00 | 3 |
| Cardowan Colliery explosion | 1932 | 11 | Cardowan | 0.00 | 6 |
| Gresford disaster | 1934 | 266 | Gresford | 0.00 | 98 |
| Wharncliffe Woodmoor colliery disaster * | 1936 | 58 | Wharncliffe Woodmoor | 0.00 | 6 |
| Croydon typhoid outbreak | 1937 | 43 | in Croydon | 0.38 | 29 |
| Castlecary rail disaster | 1937 | 35 | Castlecary | 0.00 | 7 |
| Markham Colliery disaster * | 1938 | 79 | Markham Colliery | 0.08 | 7 |
| Valleyfield mining disaster * | 1939 | 35 | Valleyfield | 0.00 | 5 |
| Booth's clothing factory fire | 1941 | 49 | in Huddersfield | 0.00 | 4 |
| Sneyd Colliery disaster * | 1942 | 57 | Sneyd | 0.00 | 6 |
| Bethnal Green tube station crush | 1943 | 173 | Bethnal Green | 3.54 | 189 |
| Freckleton air disaster | 1944 | 61 | in Freckleton | 0.00 | 0 |
| RAF Fauld explosion * | 1944 | 70 | Fauld | 0.00 | 0 |
| Burngrange mining disaster * | 1947 | 15 | Burngrange | 0.00 | 0 |
| William Pit disaster | 1947 | 104 | in Whitehaven | 0.04 | 2 |
| Llandow air disaster * | 1950 | 80 | Llandow | 0.00 | 5 |
| Knockshinnoch disaster | 1950 | 13 | Knockshinnoch | 0.00 | 11 |
| Creswell Colliery disaster | 1950 | 80 | Creswell | 0.00 | 8 |
| Easington Colliery disaster * | 1951 | 81 | Easington Colliery | 0.00 | 3 |
| Lynmouth flood | 1952 | 34 | Lynmouth | 0.00 | 23 |
| Harrow and Wealdstone rail crash | 1952 | 112 | Harrow and Wealdstone | 0.00 | 3 |
| Aquila Airways flying boat crash (Isle of Wight) * | 1957 | 45 | Chessell | 0.00 | 0 |
| Lewisham rail crash | 1957 | 90 | Lewisham | 24.21 | 1,130 |
| Auchengeich mining disaster | 1959 | 47 | Auchengeich | 0.00 | 8 |
| Six Bells colliery disaster | 1960 | 45 | Six Bells | 0.17 | 5 |
| Little Baldon air crash * | 1965 | 41 | Little Baldon | 0.00 | 0 |
| Penmaenpool ferry disaster * | 1966 | 15 | Penmaenpool | 0.00 | 0 |
| Aberfan disaster | 1966 | 146 | Aberfan | 0.00 | 203 |
| Stockport air disaster | 1967 | 72 | in Stockport | 0.17 | 17 |
| Thirsk rail crash | 1967 | 7 | in Thirsk | 0.00 | 1 |
| Hither Green rail crash * | 1967 | 49 | Hither Green | 0.08 | 25 |
| Hixon rail crash | 1968 | 11 | Hixon | 0.00 | 27 |
| Ibrox disaster | 1971 | 66 | Ibrox | 0.00 | 35 |
| Ballymurphy killings | 1971 | 11 | Ballymurphy | 0.75 | 22 |
| Bloody Sunday (Derry) | 1972 | 14 | in Londonderry | 1.38 | 163 |
| Eltham Well Hall rail crash | 1972 | 6 | Eltham Well Hall | 0.00 | 1 |
| Staines air disaster (BEA Flight 548) | 1972 | 118 | in Staines | 0.00 | 0 |
| Claudy bombing * | 1972 | 9 | Claudy | 0.00 | 6 |
| Markham Colliery cage accident * | 1973 | 18 | Markham Colliery | 0.00 | 5 |
| Flixborough disaster | 1974 | 28 | Flixborough | 0.00 | 112 |
| Birmingham pub bombings | 1974 | 21 | in Birmingham | 7.71 | 597 |
| Moorgate tube crash | 1975 | 43 | Moorgate | 0.08 | 20 |
| Golborne Colliery explosion | 1979 | 10 | in Golborne | 0.00 | 1 |
| Denmark Place fire * | 1980 | 37 | Denmark Place | 0.00 | 0 |
| Penlee lifeboat disaster | 1981 | 16 | Penlee | 0.00 | 15 |
| Droppin Well bombing (Ballykelly) * | 1982 | 17 | Ballykelly | 0.04 | 35 |
| Newry mortar attack | 1985 | 9 | in Newry | 0.46 | 32 |
| Bradford City stadium fire | 1985 | 56 | Bradford City | 0.33 | 72 |
| Hungerford shootings | 1987 | 17 | in Hungerford | 0.00 | 14 |
| Enniskillen bombing | 1987 | 11 | Enniskillen | 0.17 | 107 |
| King's Cross fire | 1987 | 31 | King's Cross | 0.50 | 1,009 |
| Piper Alpha | 1988 | 167 | Piper Alpha | 0.00 | 178 |
| Ballygawley bus bombing * | 1988 | 8 | Ballygawley | 0.00 | 9 |
| Clapham Junction rail crash | 1988 | 35 | Clapham Junction | 0.04 | 69 |
| Lockerbie (Pan Am Flight 103) | 1988 | 270 | in Lockerbie | 0.04 | 10 |
| Kegworth air disaster | 1989 | 47 | Kegworth | 0.04 | 20 |
| Marchioness disaster | 1989 | 51 | Marchioness | 0.00 | 51 |
| Dunblane school shooting | 1996 | 18 | in Dunblane | 0.04 | 87 |
| Omagh bombing | 1998 | 29 | in Omagh | 0.08 | 44 |
| Ladbroke Grove rail crash | 1999 | 31 | Ladbroke Grove | 0.17 | 66 |
| Hatfield rail crash | 2000 | 4 | in Hatfield | 0.00 | 9 |
| Great Heck rail crash | 2001 | 10 | Great Heck | 0.00 | 8 |
| Potters Bar rail crash | 2002 | 7 | in Potters Bar | 0.00 | 9 |
| Morecambe Bay cockling disaster | 2004 | 22 | Morecambe Bay | 0.21 | 104 |
| Ufton Nervet rail crash | 2004 | 7 | Ufton Nervet | 0.00 | 10 |
| Grayrigg derailment | 2007 | 1 | Grayrigg | 0.00 | 22 |
| Cumbria shootings | 2010 | 13 | in Whitehaven | 0.17 | 14 |
| Gleision Colliery accident * | 2011 | 4 | Gleision | 0.00 | 15 |
| Manchester Arena bombing | 2017 | 23 | Manchester Arena | 0.00 | 85 |
| Grenfell Tower fire | 2017 | 72 | Grenfell | 0.08 | 1,686 |
| Amesbury Novichok poisoning | 2018 | 1 | in Amesbury | 0.00 | 10 |
| Essex lorry deaths (Grays) | 2019 | 39 | in Grays | 0.00 | 8 |
| Carmont derailment | 2020 | 3 | Carmont | 0.00 | 2 |
Sources and licences
- Hansard, House of Commons spoken contributions per month, via the UK Parliament Hansard API. Contains Parliamentary information licensed under the Open Parliament Licence v3.0.
- Wikipedia: "List of disasters in Great Britain and Ireland by death toll" (CC BY-SA 4.0), retrieved 2026; death tolls of smaller events from their Wikipedia articles, checked by hand.
- Wikidata disasters in the UK, dates, places and deaths (CC0).
- Town points from Mentioned in the House (Hotham 2026, doi:10.5281/zenodo.23761431); ONS countries and regions (Open Government Licence v3.0).
- Base map: OpenFreeMap Positron style (OpenStreetMap, ODbL). MapLibre GL JS 4.7.1 (BSD 3-Clause).
- Text and figures CC BY 4.0; code MIT; derived data CC BY 4.0 (Wikipedia-derived fields CC BY-SA 4.0).