01The short answer: no
Between 1955 and 1975 Britain lost thousands of railway stations, most of them in the years after the Beeching report of 1963. It is often said that the places hit hardest are the places that voted to leave the European Union in 2016: small towns and the countryside, the places that felt left behind. Put the two maps side by side and they do look alike.
I put every station that was open in 1955 into its 2010 constituency and asked how much of its railway each seat lost. Then I compared that with the Leave vote, first simply, then comparing like with like.
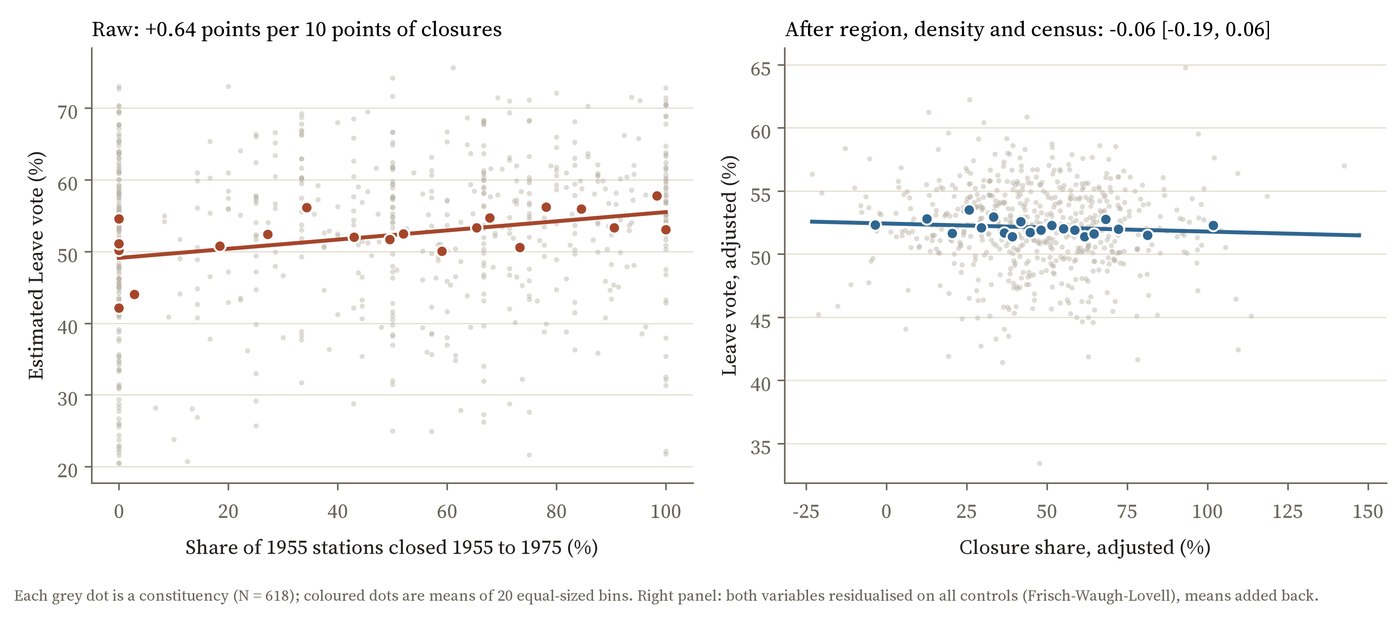
On the face of it, the more of its railway a seat lost, the more it voted Leave: 0.64 points more for every 10 points of its stations closed, and 5.2 points more in the third of seats that lost most against the third that lost least. But the cuts fell on rural, older and whiter places, and those places leaned Leave anyway. Compare seats in the same region with the same density of people, the same distance from a city, the same size of railway in 1955 and the same mix of ages, qualifications, jobs and backgrounds, and the gap disappears: -0.06 points per 10 points of closures, with a 95% range of -0.19 to 0.06.
02Where the cuts fell
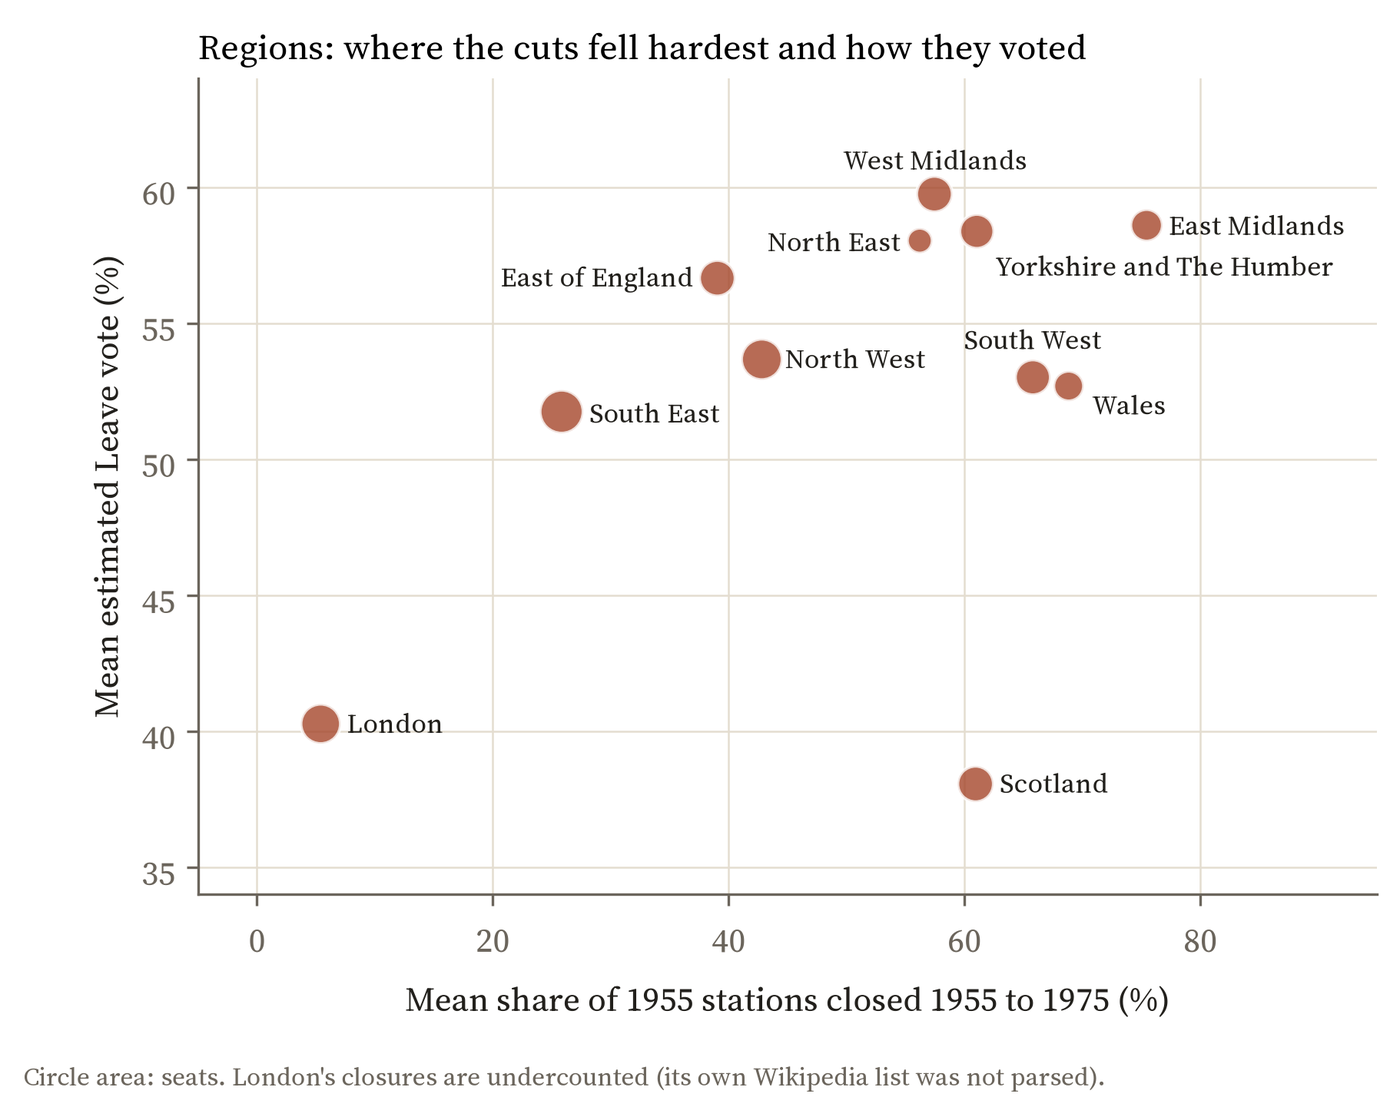
Regions differ hugely. London, where few closures are recorded, voted strongly Remain. The East Midlands lost 75% of its 1955 stations on average and voted 59% Leave. Scotland lost 61% and voted only 38% Leave. Most of the simple link between closures and Leave is this regional pattern: within the same region, 83% of it goes.
03Every way I checked
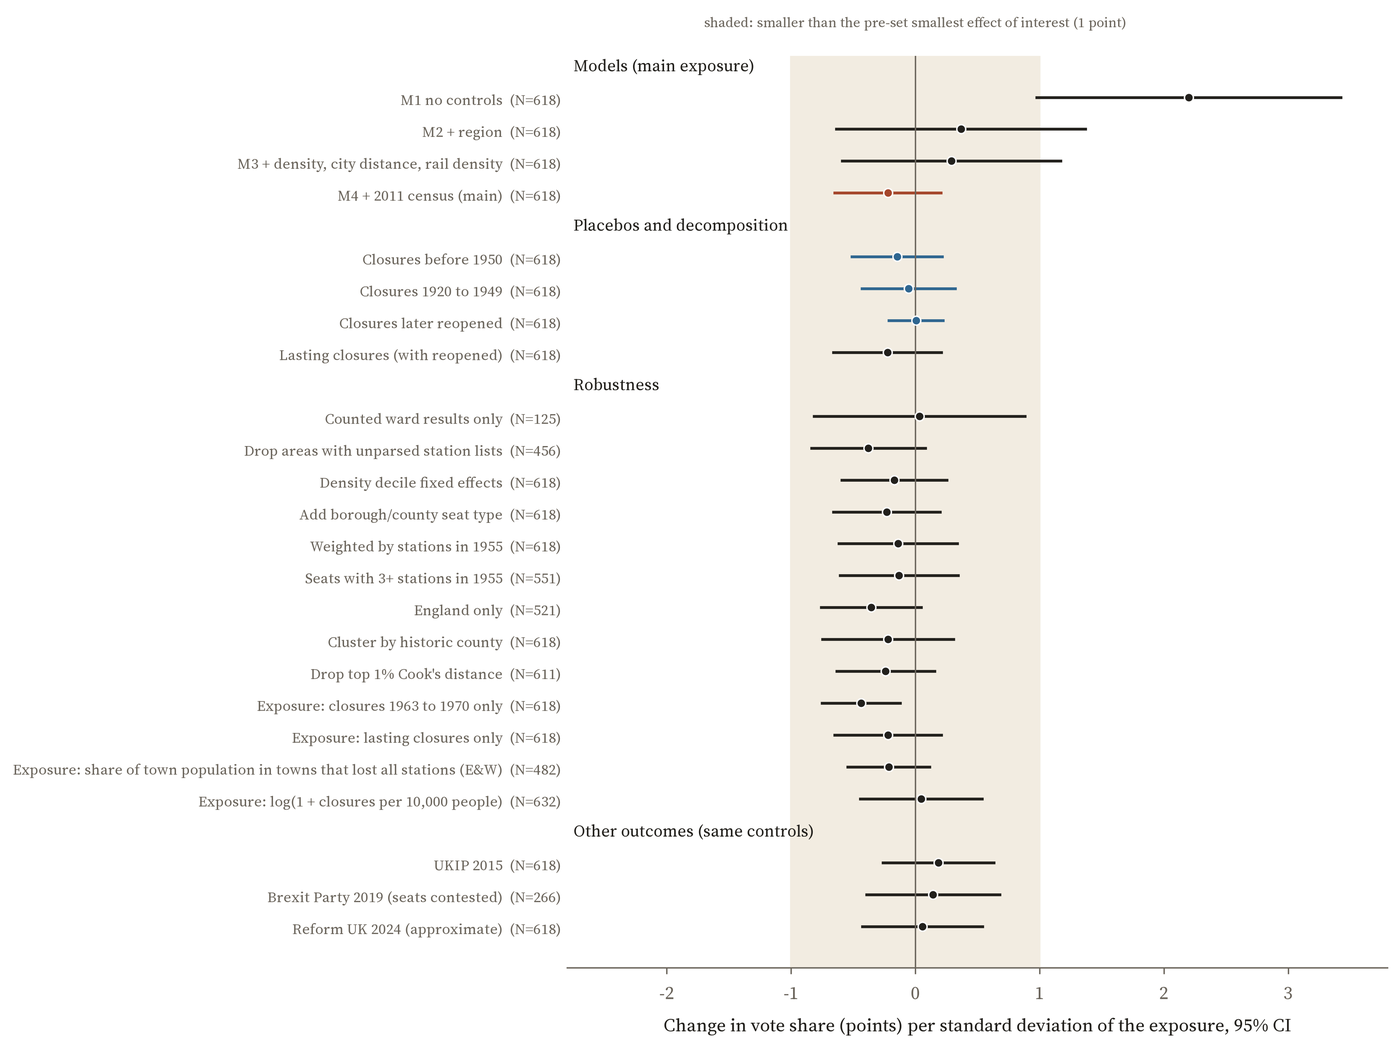
I wrote down the tests before running them. Closures before 1950, which had nothing to do with Beeching, show no link. Closures that were later reversed show none. Neither do the seats with counted ward results, the seats outside the areas where the station lists are incomplete, England alone, or the other planned variations (13 in all). Nor does the vote for UKIP in 2015, the Brexit Party in 2019 or Reform UK in 2024, once like is compared with like. One check, counting only the peak closure years of 1963 to 1970, gives a small link in the other direction.
Towns tell the same story. 643 towns in England and Wales lost every station and still have none; 981 kept one. Their seats' Leave votes differ by -0.15 points once size, region and the make-up of the seat are taken into account (95% range -0.53 to 0.23).
04What it does and does not mean
Losing the railway did not, on this evidence, leave its own mark on the 2016 vote. That does not mean the cuts did not matter. Economists have found that places that lost rail access lost people, jobs and young skilled workers over the following decades, and those changes would show up in exactly the things I compared on: age, qualifications and work. If the cuts made places older and less qualified, part of their Leave vote may trace back to the cuts through who lives there now. What this study rules out is a separate trace of the cuts on how places voted, over and above the kind of place they became.
This is a comparison of places, not an experiment. The Leave figures are estimates for constituencies, the station lists are incomplete for London and five other areas, and a constituency is a coarse unit for a loss felt by a town or a village.
05How I did this
Stations come from my earlier study of the Beeching cuts, which placed 6,449 closed stations from Wikipedia's lists and the 2,609 National Rail stations of today, with their status in 1975. I placed each in a 2010 Westminster constituency. A seat's closure share is the stations that closed from 1955 to 1975 divided by those open in 1955. The Leave vote is Chris Hanretty's estimate for each constituency. The comparisons are regressions with region, a flexible control for population density, distance to a city of 100,000 people, the density of the 1955 railway and eleven measures from the 2011 census, with uncertainty allowing for seats in the same council. The plan, the placebo tests and the equivalence test were fixed before the results were seen.
All the numbers
| Model | Per 10 points | 95% range | Seats |
|---|---|---|---|
| No comparison | 0.64 | 0.28 to 0.99 | 618 |
| Same region | 0.11 | -0.18 to 0.40 | 618 |
| + density, city, railway size | 0.08 | -0.17 to 0.34 | 618 |
| + census (main) | -0.06 | -0.19 to 0.06 | 618 |
| Placebo: closures before 1950 | -0.07 | -0.25 to 0.11 | 618 |
| Placebo: closures later reopened | 0.01 | -0.25 to 0.27 | 618 |
| UKIP 2015 | 0.05 | -0.08 to 0.18 | 618 |
| Brexit Party 2019 | 0.04 | -0.11 to 0.20 | 266 |
| Reform UK 2024 | 0.02 | -0.12 to 0.16 | 618 |
Points of vote share per 10 percentage points of a seat's 1955 stations closed. Full tables in the paper.